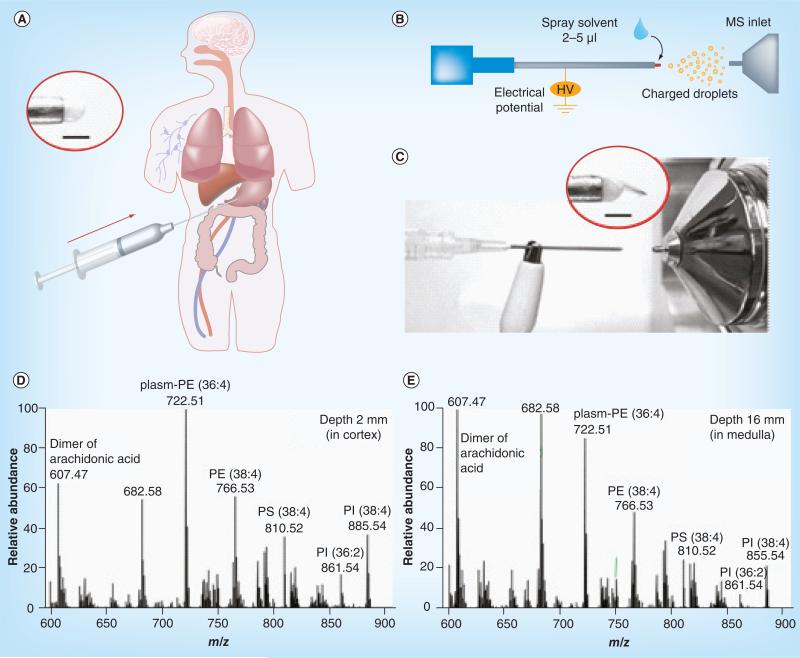
Figure 3. Direct analysis of tissue samples using tissue spray.
(A) Direct spray ionization from a biopsy needle for biological tissue analysis. The inset shows biological tissue held by the needle without added spray solvent. (B) Schematic and (C) photo of direct spray ionization with needle biopsy on tissue. Inset shows Taylor cone formed at the tissue after applying high voltage and spray solvent. Scale bar is 1 mm. MS spectra of tissue samples at (D) 2 mm and (E) 16 mm from a porcine kidney surface, recorded using an Exactive Orbitrap.
HV: High voltage.
Adapted with permission from [18].

