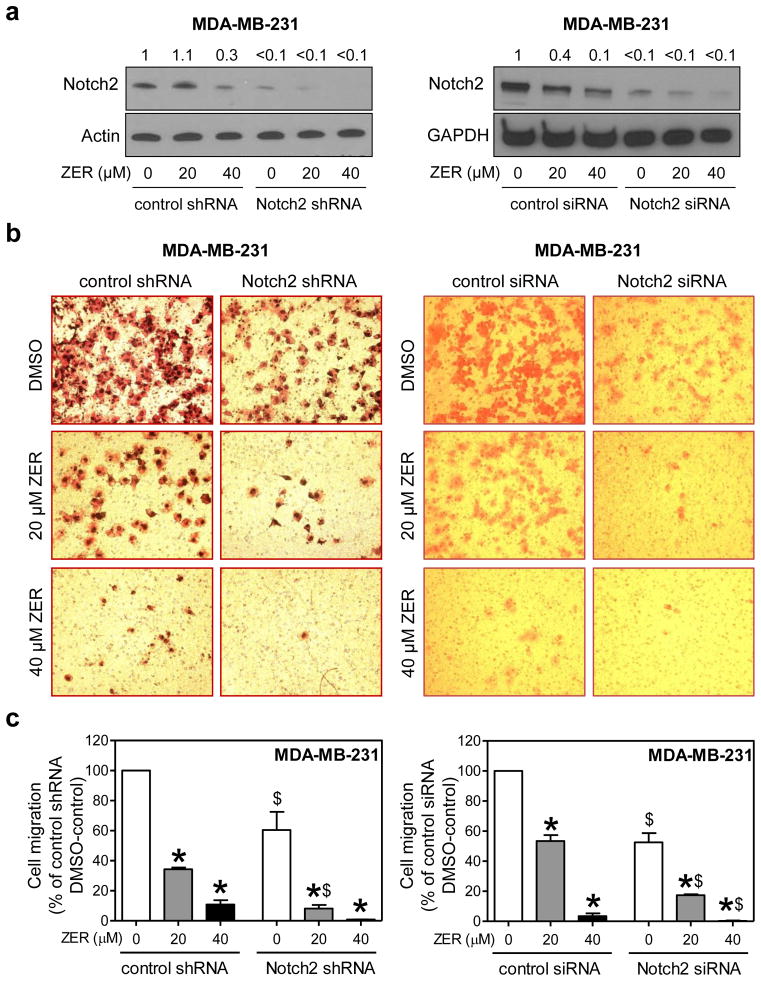
Fig. 5.
Knockdown of Notch2 augmented ZER-mediated inhibition of cell migration in MDA-MB-231 cells. a Western blotting for Notch2 in MDA-MB-231 cells stably or transiently transfected with control shRNA or siRNA or Notch2-targeted shRNA or siRNA and treated for 24 h with DMSO or ZER (20 or 40 μM). Change in protein level relative to DMSO-treated control shRNA or control siRNA transfected cells is shown above band. b Representative microscopic images depicting MDA-MB-231 cell migration after 24 h treatment with DMSO or ZER (20 or 40 μM) (100× magnification). c Quantitation of cell migration (mean ± S.D; n=3). Three-four fields on each filter were scored under an inverted microscope in each experiment. Significantly different (P<0.05) compared with *corresponding DMSO control, and $between control shRNA or siRNA and Notch2 shRNA or Notch2 siRNA transfected cells by one-way ANOVA followed by Bonferroni’s multiple comparison test. Cell migration relative to DMSO-treated control shRNA or control siRNA transfected cells is shown. Similar results were observed in two independent experiments. Representative data from one such experiment in triplicate are shown.

