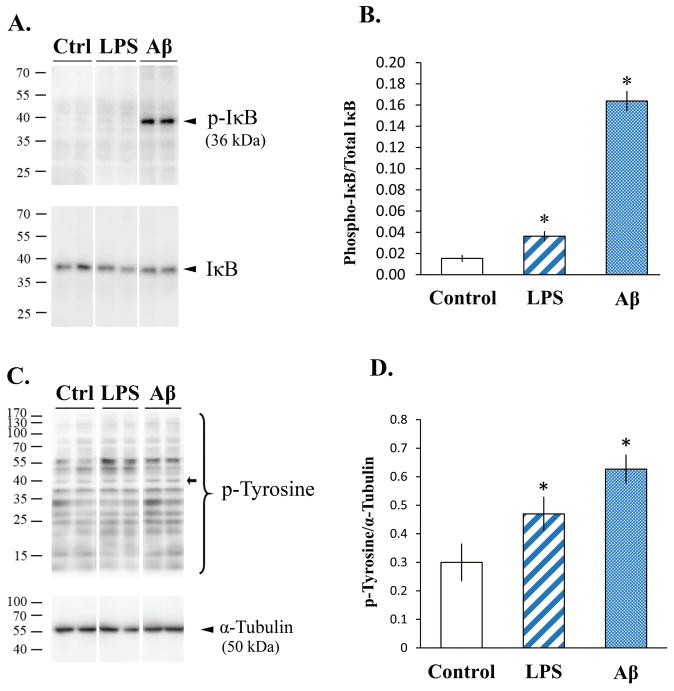
Fig. 5. Western blot images and quantitation of phospho-IκB (p-IκB) and phospho-tyrosine (p-Tyrosine) in SIM-A9 cells after LPS or Aβ stimulation.
SIM-A9 cells were incubated without (Ctrl or Control) or with 25 ng/mL LPS or 10 μM Aβ1-42 for 5 min and the levels of phosphorylated IκB (A & B) and tyrosine residues (C & D) were examined by western blot analysis. Panels A and C show chemiluminescent detection of western blots, and graphs B, and D depict quantitative values from the corresponding blots. Asterisks (*) indicate statistical significance with a p value <0.001 when compared to unstimulated SIM-A9 cells.

