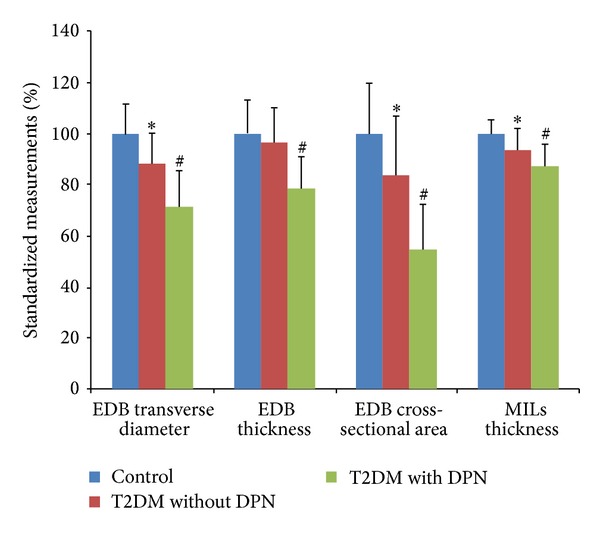
Figure 2.

Standardized measurements of the extensor digitorum brevis muscle (EDB) and the muscles of the first interstitium (MILs). The graph shows the standardized measurements when the measured values of the control group are normalized as 100. ∗ indicates P < 0.01 when compared with the control group. # stands for P < 0.01 when compared with the T2DM without DPN group.
