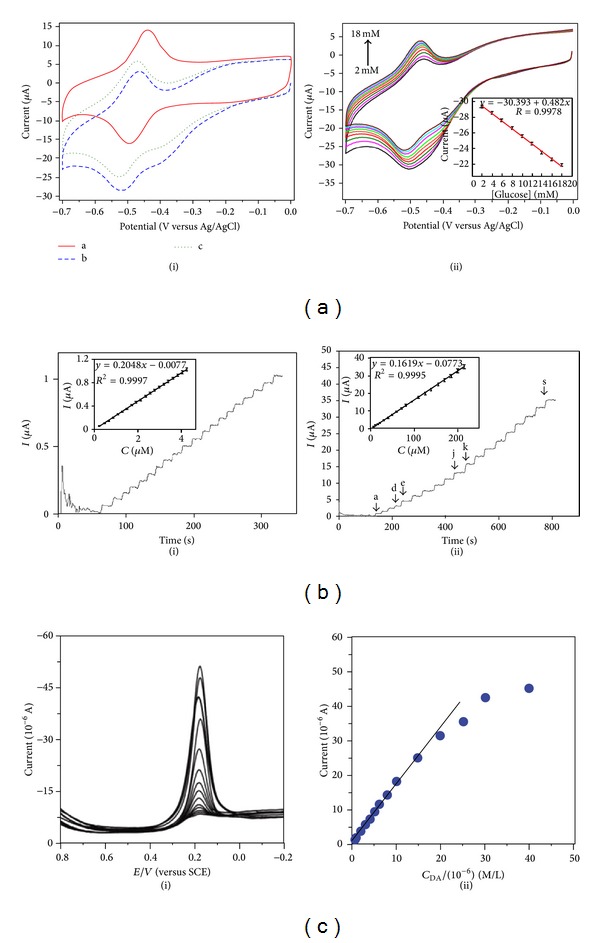
Figure 4.

Some representative experimental data from graphene based biosensors. (a) Graphene based glucose biosensor: (i) O2 saturated PBS solution without glucose and (ii) O2 saturated PBS solution with different concentrations of glucose. (b) Graphene based cholesterol biosensor: (i) 0.25 μM cholesterol and (ii) (a-dd) 5 μM, (e-j) 10 μM, and (k-s) 15 μM cholesterol. (c) EDTA-RG/Nafion electrode. (i) Concentrations from 0.20 to 40.00μM (with 1 mM AA in pH) 7.2 PBS. (ii) The relation between the current and concentrations (figures reproduced from [153, 160, 168] with permission from Elsevier and American Chemical Society, respectively).
