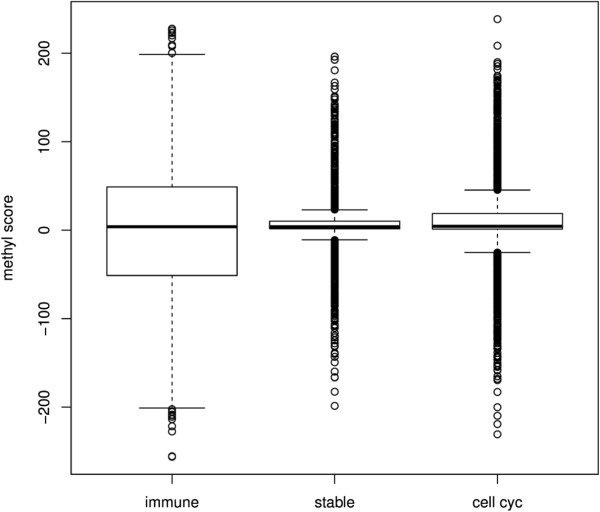
Figure 2.

Comparison of methyl scores in the region between +2,000 and −2,000. Boxplot showing the median and interquartile range of methyl scores of probes related to the immune-inflammatory genes (n = 5,422), cell cycle (n = 4,538), and stably expressed genes (n = 2,349). Note that the variation of probes in the immune group, seen by the breadth of quartiles, is higher than in the stable and cell cycle groups (p < 2.2e − 16).
