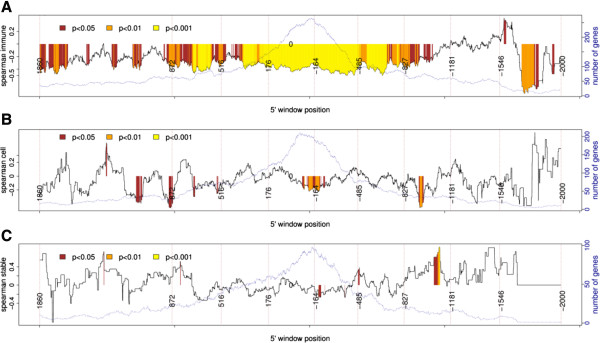
Figure 8.

Analysis of the correlation between variations in methylation (frequency of negative probes × methyl score) and mRNA. The position of the probes in the immune (A), stable (B), and cell cycle (C) groups was matched using a sliding window of 140 bases (with a shift of one base) starting at a window with sequences ranging from +2,000 to +1,860 (within gene) towards 5′, ending at a window with a sequence range of −1,860 to −2,000 (promoter). The continuous black line shows the correlation values (Spearman's rank). Colors indicate the statistical significance of the correlation analysis. The dotted blue line indicates the number of genes in each window. Note that the largest areas with significant correlations (colored) are observed in the immune group.
