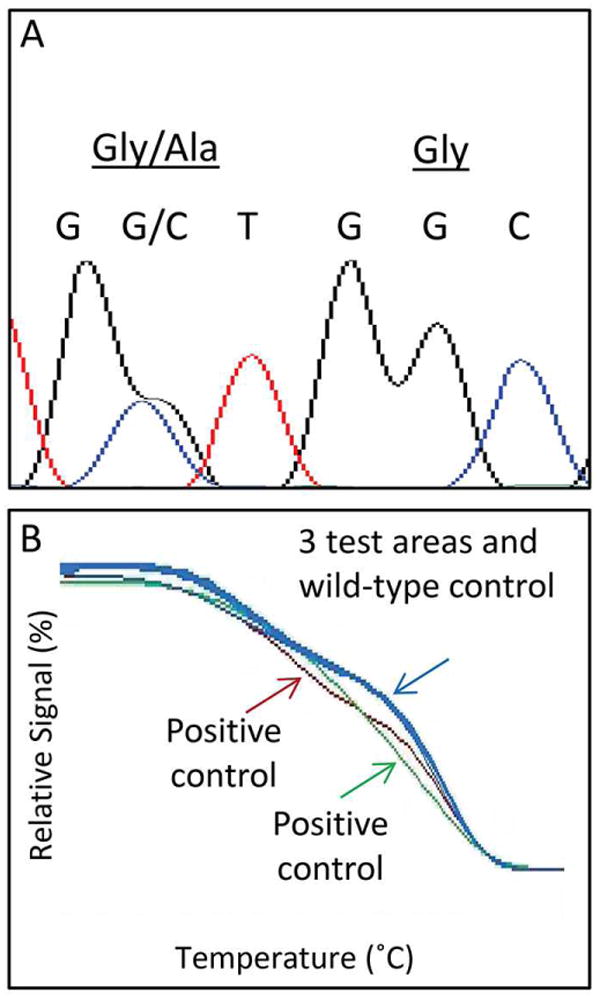
Figure 3.

A) Representative sequencing findings of KRAS mutated area. B) Representative high-resolution melting analysis of regions negative for KRAS mutation by sequencing. Blue curves show overlap of tested regions with wild-type control, red and green show positive controls (2 distinct mutations)
