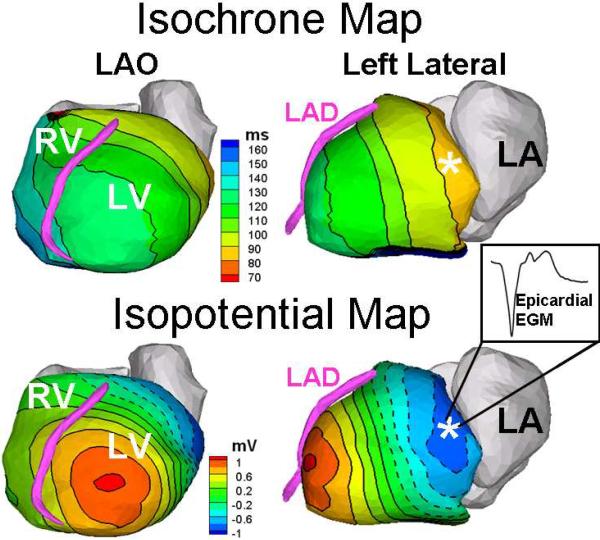
Figure 2.
ECGI isochrones and potential maps localizing the VT origin to the basal antero-lateral surface of the LV. Note the Q-wave morphology of the ECGI-reconstructed epicardial electrogram (EGM)at that site [inset], indicating an epicardial source. The asterisk in the isochrone map marks the site of earliest activation; the asterisk in the potential map is the local potential minimum associated with earliest activation.

