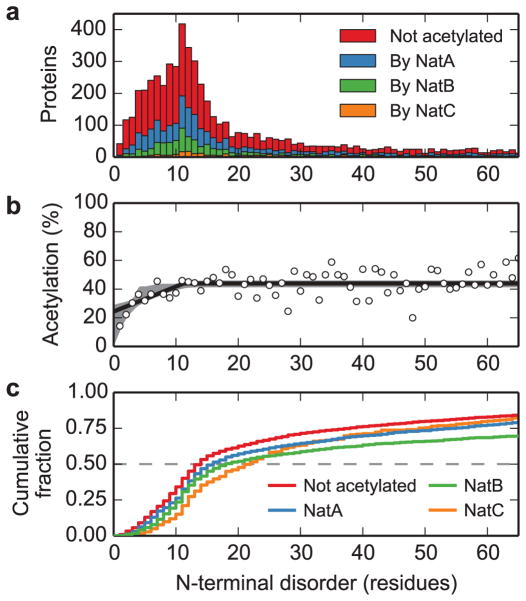
Fig. 3. N-terminal acetylation correlates with structural flexibility at the N terminus.
a. The distributions of the lengths of N-terminal disordered regions for the yeast proteome are shown as a function of acetylation status: non-acetylated (red) and acetylated by NatA (blue), NatB (green) and NatC (orange). b. The fraction of proteins predicted to be acetylated is shown as a function of the length of predicted disordered region (points), including the maximum-likelihood threshold model (solid line) and 95% confidence interval from modeling (grey shaded region). This model fits the data significantly better than a model with constant probability of acetylation (likelihood ratio test: difference in log-likelihood = 25.9, 2 degrees of freedom, p < 10−11). c. The cumulative fraction of proteins with length of N-terminal disorder less than or equal to the given values, by acetylation status (color as described in panel a). These distributions are all significantly different from each other (pairwise two-sample Kolmogorov-Smirnov tests, all p < 2×10⁻³, see Supplementary Table 4 for details).

