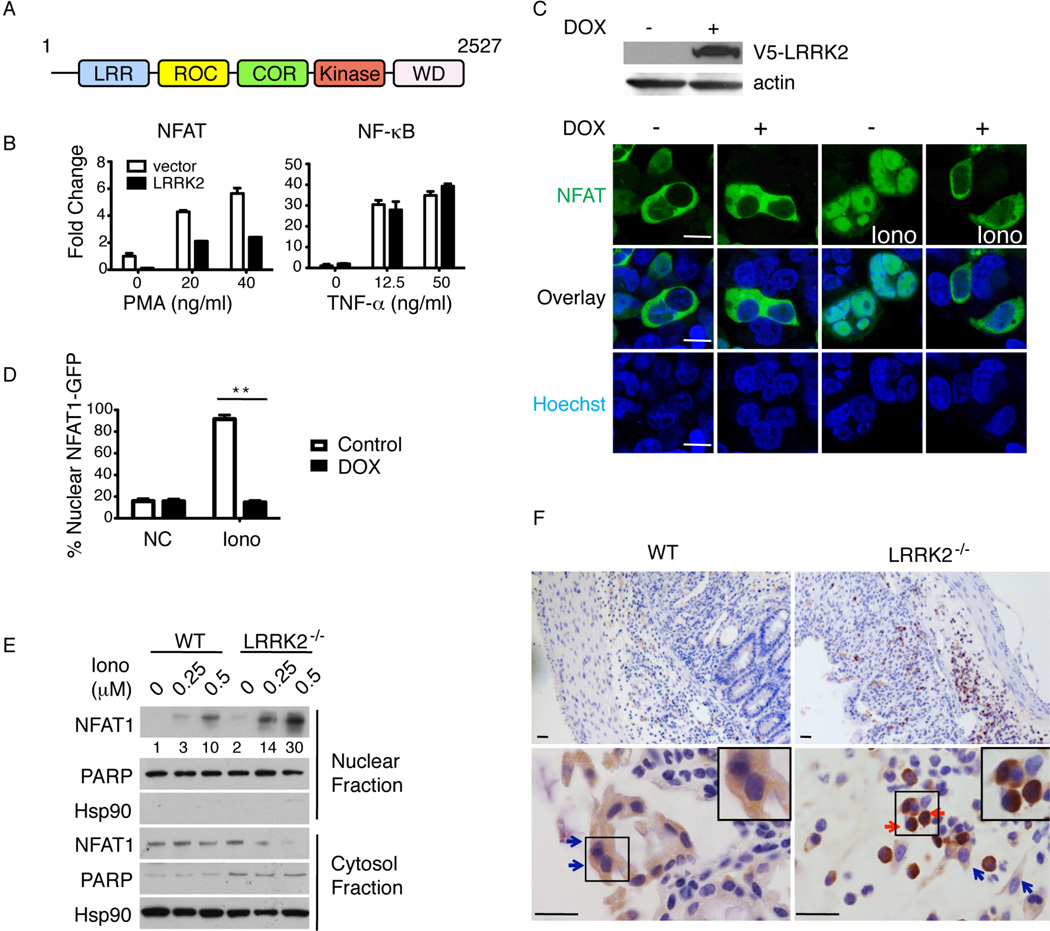
Fig. 2.
LRRK2 inhibits NFAT1 nuclear function. (A) Schematic of LRRK2 structure. (B) NFAT- and NF-κB-induced luciferase activity in 293T cells transfected with vector or LRRK2 stimulated with 0.5 µM ionomycin and phorbol myristate acetate (PMA) or TNF-α at indicated doses. Data are means of triplicate wells with SEM. (C) Immunoblotting of V5-LRRK2 and actin from 293T cells with a tet-regulated LRRK2 expression construct uninduced (−) or induced with 5 µg ml−1 doxycycline (DOX)(+), top panels. Confocal images of NFAT1-GFP transfected into 293T cells with DOX-inducible V5-LRRK2 before and after 1 µM ionomycin (Iono), Lower panels. Hoechst nuclear staining (blue). Scale bar, 5 µm. (D) Percentage of cells with nuclear NFAT1-GFP among ~100 GFP-positive cells for each condition in (C). Error bars indicate SEM for 10 fields in three experiments. **P < 0.01. (E) Representative immunoblotting of NFAT1 in nuclear vs. cytosolic fractions from BMDM treated with Iono at the indicated doses (µM) for 30’. Numbers below the NFAT1 blot are the quantified relative ratio of NFAT1 in nuclear fractions. (F) Representative images of NFAT1 immunohistochemical staining in colon sections. Cells with cytosolic NFAT1 staining (blue arrows) and nuclear NFAT1 staining (red arrows) are noted. Inset panels, enlarged cells. Scale bar, 25 µm. B–F are representative of three experiments.

