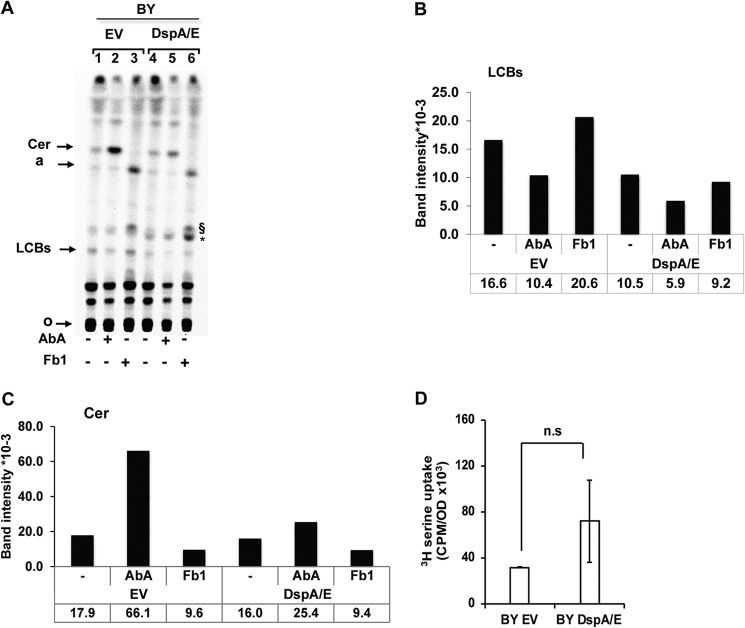
FIGURE 5.
DspA/E expression alters sphingolipid biosynthesis. A, TLC analysis of [14C]serine-labeled sphingolipids. 10 A600 units of BY cells harboring EV or expressing DspA/E were grown on SD-Ura medium supplemented or not with ceramide synthase inhibitor (Fb1; 100 μg·ml−1) or IPC synthase inhibitor (AbA; 1 μg·ml−1) before labeling. Lipids were extracted, O-deacetylated by NaOH treatment, and resolved by TLC in chloroform/methanol/NH4OH (40:10:1, v/v/v). Radiolabeled sphingolipids were revealed and quantified using a Storm phosphorimaging system. The same amount of cells (2.5 A600 units) was spotted for each sample. Assignments are supported by (I) the accumulation or absence of major bands upon specific inhibitor treatments, (II) comparison with cold PHS and DHS standards revealed by nihydrin and (iii) previous report (36, 45). Cer, ceramide; a, lipid a (36); §, uncharacterized Fb1-induced lipid (45); *, uncharacterized DspA/E-induced lipid; o, origin. The image presented is representative of three independent repetitions. B and C represent the quantification of LCBs and ceramides, respectively, shown in A in band intensity ×10−3. D, serine uptake assay in BY EV and BY DspA/E cells. Cells were labeled with [3H]serine, and incorporation of [3H]serine was measured by a scintillation counter. Results are represented as means, and error bars represent S.D. (n = 3; p > 0.1; n.s, not significant; two-tailed Student's t test).

