FIGURE 3.
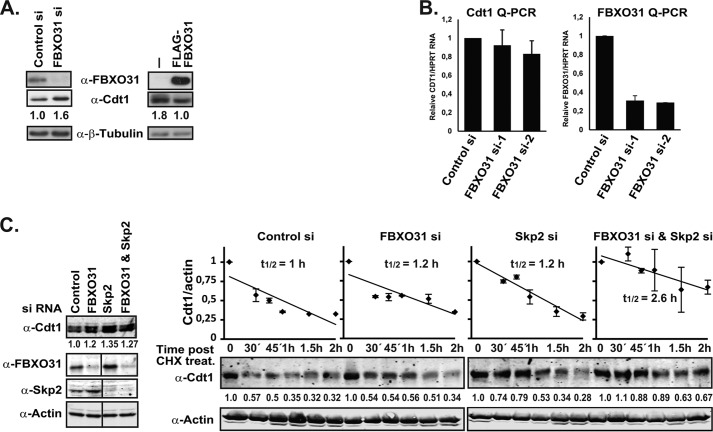
FBXO31 regulates Cdt1 protein stability. A, H1299 cells were transfected with FBXO31 (siRNA-1) or control siRNA and Western-blotted with anti-FBXO31, anti-Cdt1, and anti-β-tubulin (loading control) antibodies. Additionally, HEK293T and HEK293T cells overexpressing FLAG-FBXO31 were Western-blotted with anti-FLAG, anti-Cdt1, and anti-β-tubulin (loading control) antibodies. Cdt1 protein levels were then quantified using the ImageJ software and normalized against β-tubulin. B, asynchronous HeLa cells were transiently transfected with control or FBXO31 siRNAs, and Cdt1 and FBXO31 mRNA levels were measured using RT-qPCR assay and normalized against HPRT1 mRNA. C, asynchronous HeLa cells were transiently transfected with control, FBXO31 (siRNA-2), Skp2 or FBXO31 (siRNA-2), and Skp2 siRNA, subsequently treated with cyclohexamide (CHX; 100 μm) and harvested at the indicated time points for Western blot analysis using anti-Cdt1 and anti-actin antibodies. Protein extracts from the zero time point were also analyzed on Western blots with anti-FBXO31 and anti-Skp2 antibodies. Fluorescently labeled secondary antibodies were used, and the blots were scanned on a Li-Cor Odyssey scanner. Cdt1 protein levels were then quantified using the ImageJ software and normalized against actin. The 0 time point for each siRNA treatment was set to 1. Half-life analysis is based on two independent experiments. Note that a lane is taken out of the FBXO31, Skp2, and actin blots on the left where marked on the image, but they each represent the same blot and exposure.

