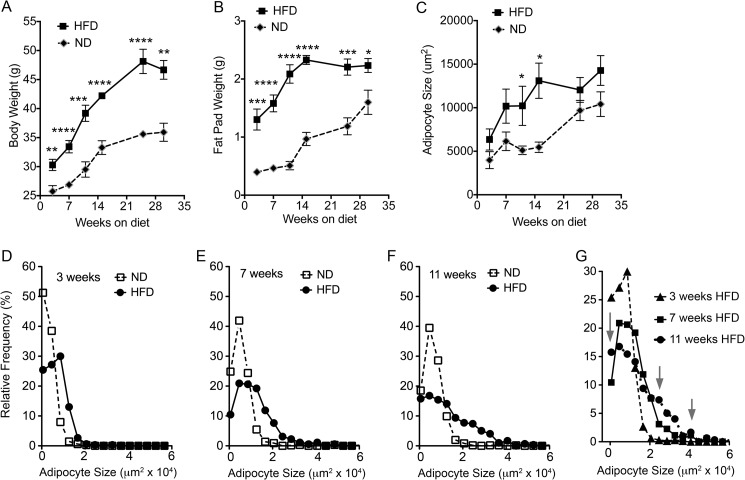
FIGURE 1.
Time course of epididymal fat pad expansion in response to ND or HFD feeding. Body weight (A), epididymal fat pad weight (B), and mean adipocyte size (C) are given at the indicated time points after initiation of diets in 5-week-old mice. Points represent the mean and S.E. of eight mice per condition. Statistical significance was assessed by two-tailed paired t tests for each group. *, p < 0.05; **, p < 0.01; ***, p < 0.001; ****, p < 0.0001. Comparison of the size distribution of adipocytes at 3 weeks (D), 7 weeks (E), and 11 weeks (F) of HFD feeding compared with ND is shown. G, size distribution of adipocytes at 3, 7, and 11 weeks of ND or HFD feeding. Arrows point to appearance of peaks in lower and higher size bins after 11 weeks of HFD.

