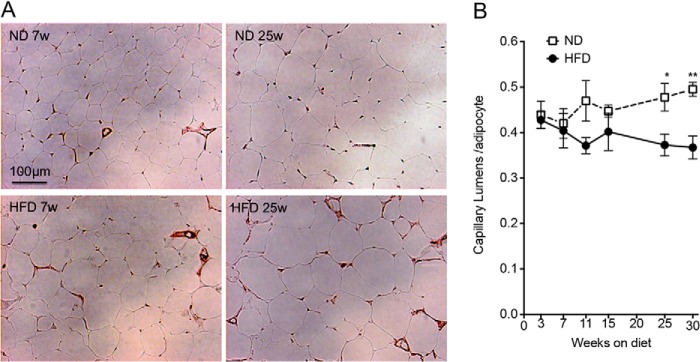
FIGURE 4.

Time course of changes in capillary density in response to HFD. A, representative images of anti-CD31 immunohistochemistry of epididymal adipose tissue from ND- (top) or HFD (bottom)-fed mice at 7 (left panels) or 25 (right panels) weeks after diet initiation. B, mean and S.E. of capillary lumens per adipocyte assessed by immunohistochemistry. Values were derived from analysis of five fields per section, from two independent sections per mouse derived from four independent mice. Statistical significance was assessed by two-tailed paired t tests. *, p < 0.05; **, p < 0.01.
