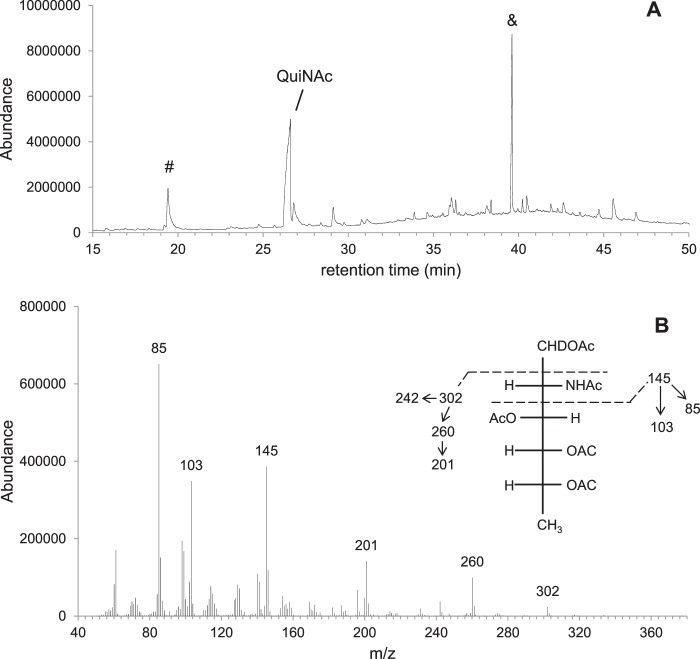
FIGURE 4.
GC-MS analysis of chemical derivatives after converting sugars to alditol acetates. A, GC profile of derivatives from the WbpM-WreQ reaction products. B, MS spectrum of the QuiNAc derivative peak in A. Inset, predicted MS fragmentation patterns of the alditol acetates derived from QuiNAc. MS peaks corresponding to the predicted fragmentation pattern are shown with numbers above. The peak designated with & in A is a common non-sugar peak. The peak designated with # may have resulted from other components in the enzyme reaction.

