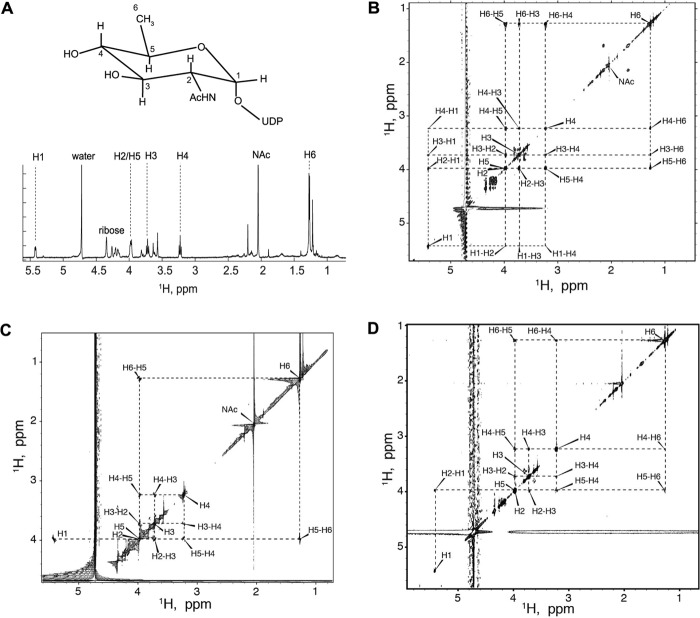
FIGURE 5.
Structural determination for UDP-QuiNAc. A, structure and proton NMR resonance assignments of the reaction product deduced to be UDP-d-QuiNAc. B–D, two-dimensional 1H-1H TOCSY, COSY, and NOESY analysis of UDP-QuiNAc. B, two-dimensional 1H-1H TOCSY correlation map for UDP-QuiNAc. C, two-dimensional 1H-1H COSY correlation map for UDP-QuiNAc. The experiment was acquired in real time mode; therefore, all resonances with chemical shifts beyond water appear mirrored. D, two-dimensional 1H-1H NOESY correlation map for UDP-QuiNAc.

