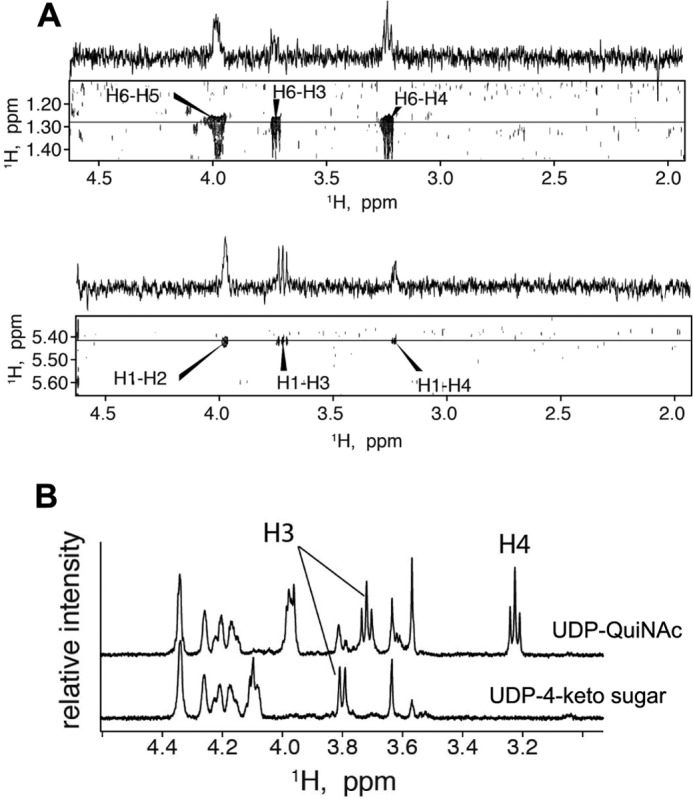
FIGURE 6.

Assignment of proton chemical shifts for H3 and H4. A, strips of two-dimensional 1H-1H TOCSY correlation map for UDP-QuiNAc and one-dimensional slices taken at frequencies of H6 (top panel) and H1 (bottom panel) in indirect dimension demonstrating relative intensities of the cross-peaks. B, comparison of one-dimensional proton NMR spectra of purified UDP-QuiNAc (top trace) and UDP-2-acetamido-2,6-dideoxy-α-d-xylo-4-hexulose (UDP-4-keto sugar) (bottom trace).
