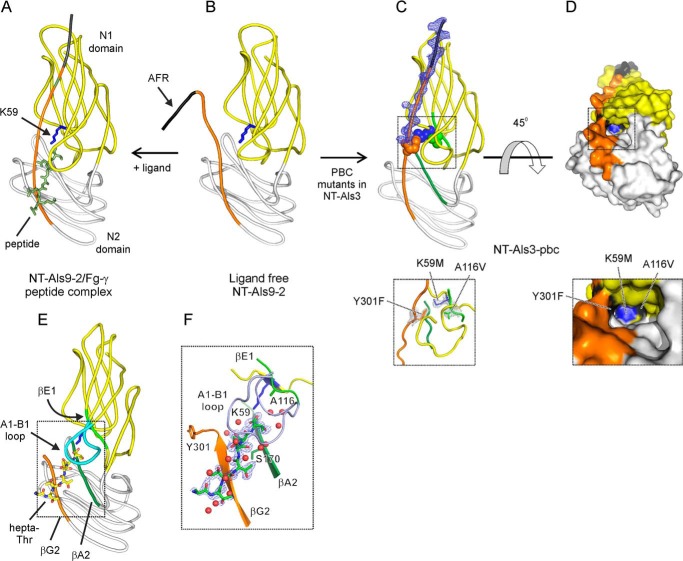
FIGURE 3.
Crystal structures of NT-Als3-pbc and sNT-Als3. A and B, the structures of NT-Als9-2 in complex with Fg-γ peptide and in free form (14) are displayed as a reference to illustrate the effect of mutations in the PBC of NT-Als3. C, the crystal structure of NT-Als3-pbc shows a well formed, empty PBC. Inset below, the mutated side chains form a hydrophobic patch in the PBC. D, surface representation of NT-Als3-pbc is rotated 45° clockwise in the x axis relative to C. The inset below shows the mutated side chains at the end of the PBC. E, diagram shows sNT-Als3 in complex with a hepta-Thr ligand. F, detail shows interactions between the sNT-Als3 binding site and hepta-Thr. Secondary structure elements that form the binding site are labeled as previously (14) and colored as in C. Red spheres represent water molecules. Sigma-A weighted Fo − Fc omit map for these structural models (generated using simulated annealing within PHENIX) were contoured at 3 Å r.m.s.d. electron density around the C terminus and mutated residues in NT-Als3-pbc (A and B), and at 1.6 Å r.m.s.d. for the hepta-Thr peptide in sNT-Als3. Details of x-ray crystallographic data collection, processing, and structure refinement are in Table 1.

