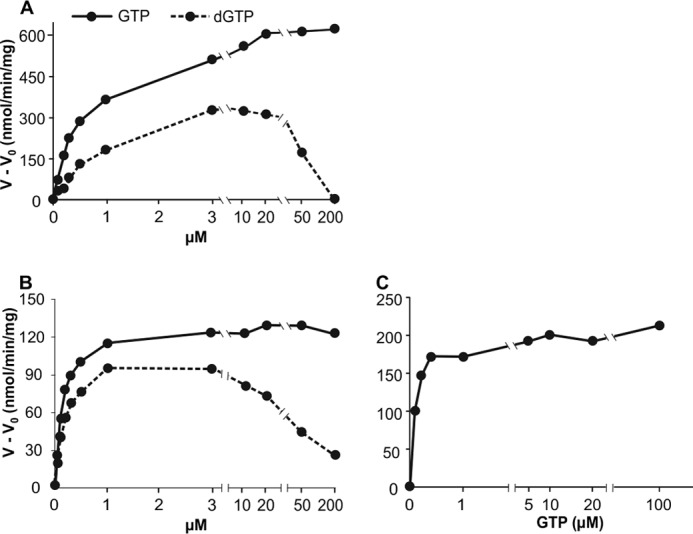
FIGURE 3.

GTP and dGTP as effectors for the dephosphorylation of dATP and dTTP. Upper row, mouse SAMHD1; lower row, human SAMHD1. A, and B, dephosphorylation of 100 μm [3H]dATP by 50 ng of mouse SAMHD1 (A) or 150 ng of human SAMHD1 (B), at the GTP or dGTP concentrations shown on the abscissa. C, dephosphorylation of 100 μm [3H]dTTP by 150 ng of human SAMHD1. General conditions are as in Fig. 2. Ordinates show V − Vo where V is the rate of dephosphorylation in the presence of effector and Vo is the rate in its absence.
