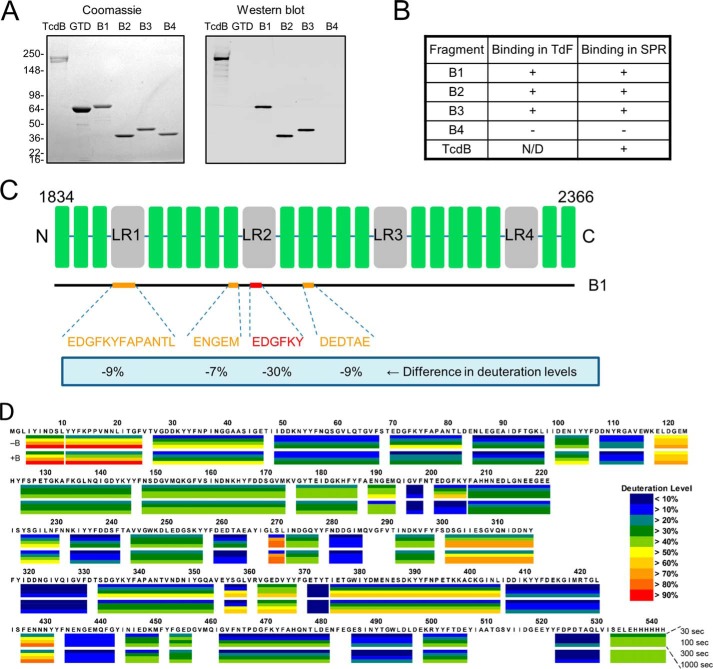
FIGURE 2.
Identification of the bezlotoxumab-binding regions within the TcdB CROP domain. A, Coomassie Blue-stained polyacrylamide gel and Western blot showing binding of bezlotoxumab to intact TcdB and to peptides B1, B2, and B3 but not to peptide B4 or to the TcdB catalytic domain (GTD). Molecular masses (kDa) of markers are indicated on the left. B, binding of bezlotoxumab to full-length TcdB, B1, B2, and B3, but not B4, as assessed by TdF and SPR. C, summary of HDX-MS experiments showing regions of the CROP domain that are protected from deuteration in the presence of bezlotoxumab and extent of protection. D, details of the HDX-MS analysis showing deuteration levels (color key at lower right) for peptide B1 alone (top, −B) and in the presence of bezlotoxumab (bottom, +B). Each box represents a distinct peptide identified by MS and is subdivided into four time points: 30, 100, 300, and 1000 s from top to bottom (see “Experimental Procedures”). The numbering used is that of full-length TcdB. The differences between deuteration levels in the presence versus the absence of bezlotoxumab were averaged over all time points, and significant differences are reported in Fig. 2C.

