
FIGURE 6.
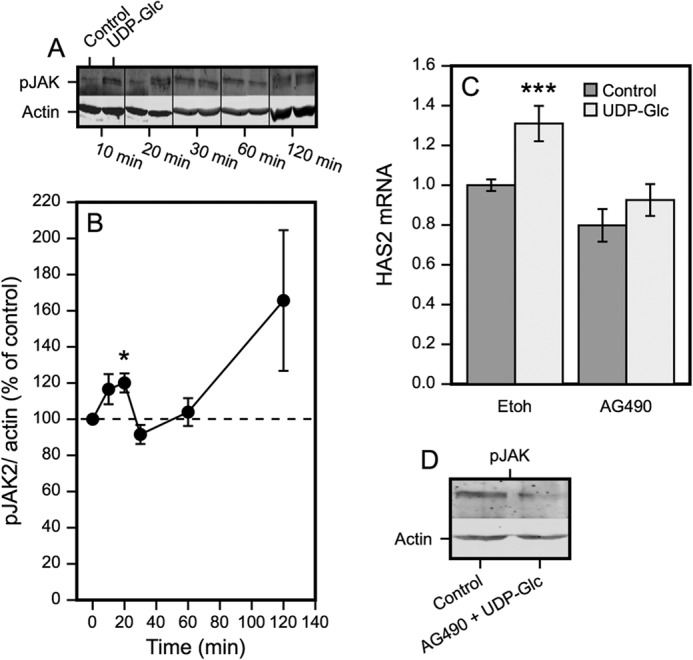
JAK2 phosphorylation associates with UDP-Glc-stimulated HAS2 expression. A, Western blots of pJAK2 at the indicated times following introduction of 100 μm UDP-Glc. B, quantitation of the Western blots from 4–6 separate experiments at each time point, normalized to β-actin. *, p < 0.05, UDP-Glc versus control, by paired sample t test. C, effect of the JAK2 inhibitor AG490 (30 μm) on HAS2 expression in cultures treated with or without 100 μm UDP-Glc. The cultures were preincubated for 120 min with the inhibitor, followed by 120 min with or without 100 μm UDP-Glc. The data represent mean ± S.E. of 5 independent experiments. Statistical significance, control versus UDP-Glc: ***, p < 0.001 (Dunnett's test). D, verification of AG490 effect on JAK2 phosphorylation. The cultures were preincubated for 120 min with or without the inhibitor, followed by 120 min with or without 100 μm UDP-Glc.