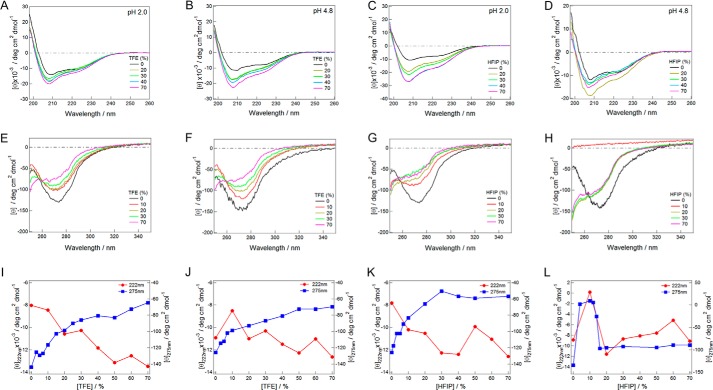
FIGURE 1.
TFE or HFIP-dependent conformational transitions of insulin immediately after sample preparation. A–D, far-UV CD spectra in the presence of various concentrations of TFE (A and B) or HFIP (C and D) at pH 2 (A and C) and 4.8 (B and D). E–H, near-UV CD spectra in the presence of various concentrations of TFE (E and F) or HFIP (G and H) at pH 2.0 (E and G) and 4.8 (F and H). I–L, transition curves dependent on TFE (I and J) or HFIP (K and L) concentrations at pH 2 (I and K) or 4.8 (J and L) monitored by ellipticity at 222 or 275 nm. Measurements were performed immediately after sample preparation.

