
FIGURE 5.
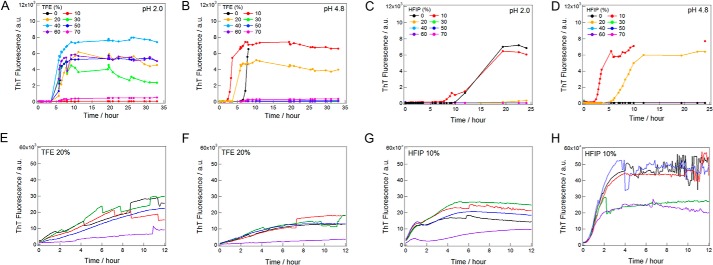
Kinetics of ultrasonication-triggered and seed-dependent insulin fibrillation under various alcohol conditions. Ultrasonication-dependent fibrillation was monitored at various concentrations of TFE (A and B) or HFIP (C and D) at pH 2.0 (A and C) or 4.8 (B and D). Seed-dependent reactions were monitored at 20% TFE and pH 2.0 (E) or 4.8 (F), or at 10% HFIP and pH 2.0 (G) or 4.8 (H). Kinetics were measured on 96-well microplates with a sample volume of 200 μl. Because higher concentrations of TFE or HFIP prevented the measurement of ThT fluorescence, we only showed the data obtained following successful kinetic monitoring. Curves in panels E-H with different colors indicate the results at different wells.