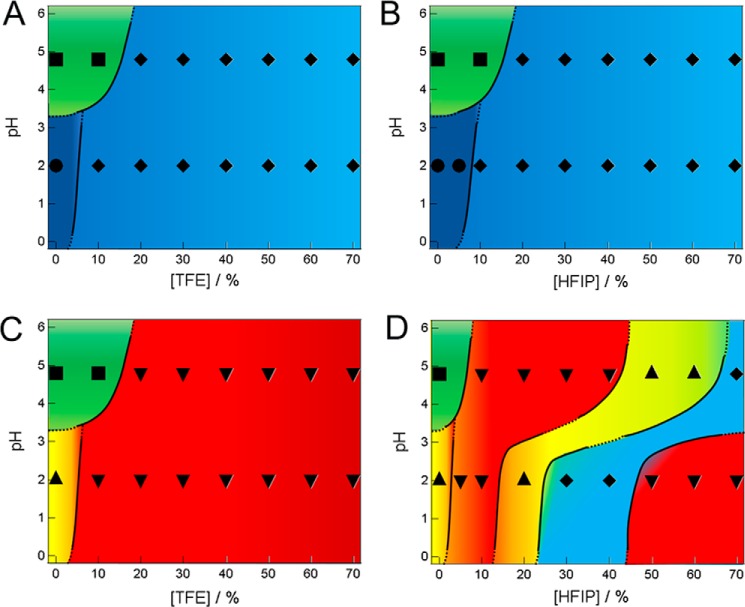
FIGURE 6.
Phase diagrams of the alcohol- and pH-dependent conformational states of insulin at 1.5 mg ml−1 before and after ultrasonication obtained with TFE or HFIP. Phase diagrams obtained before (A and B) and after (C and D) ultrasonication are represented by dominant species even when distinct states coexisted, as indicated by symbols (●, ♦, ■, ▴, ▾). Vivid blue, native monomers (●); light blue, unfolded monomers (♦); green, amorphous aggregates (■); yellow, parallel β fibrils (▴); red, antiparallel β fibrils (▾).

