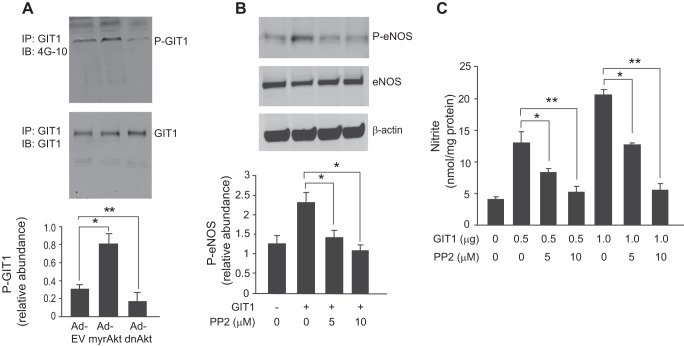
FIGURE 3.
Akt stimulates GIT1 tyrosine phosphorylation, and Src regulates GIT1/eNOS/NO signaling. In A, sinusoidal endothelial cells were infected with adenovirus (m.o.i. 250) encoding constitutively active Akt (Ad-myrAkt), dominant negative Akt (Ad-dnAkt), or an empty vector (Ad-EV) for 36 h. GIT1 tyrosine phosphorylation (upper panel) and total GIT1 (middle panel) were assayed as in Fig. 2. In the graph shown in the bottom panel, bands corresponding to phospho-GIT1 (P-GIT1) were quantified and normalized to total GIT1 (n = 3; error bars represent S.E.; *, p < 0.05; **, p < 0.01 versus Ad-EV control). In B, sinusoidal endothelial cells as in Fig. 2 were exposed to the Src inhibitor PP2 (5–10 μm) for 2 h, and then cDNA encoding full-length GIT1 (1 μg) was transduced for an additional 24 h. Cells were harvested, and cell lysates were immunoblotted (IB) to detect phospho-eNOS (P-eNOS) (Ser1177), total eNOS, and β-actin. In the bottom graph, bands corresponding to phospho-eNOS were quantified and normalized to total eNOS (n = 3; error bars represent S.E.; *, p < 0.01 versus GIT1 transfection control). In C, cells were treated as in B, conditioned medium was collected, and nitrite levels were measured as under “Experimental Procedures.” Quantitative data are shown graphically (n = 3; error bars represent S.E.; *, p < 0.05; **, p < 0.01 versus GIT1 transfection control). IP, immunoprecipitation.

