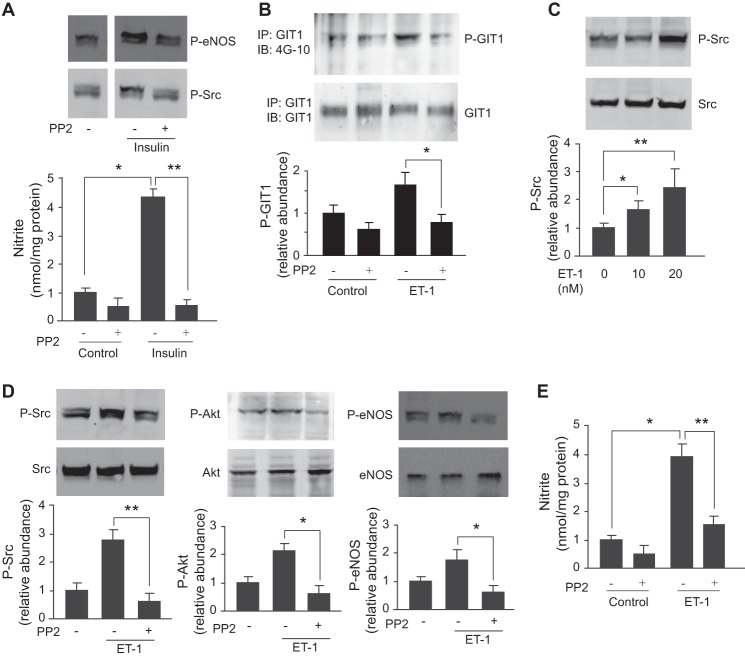
FIGURE 6.
ET-1 regulates GIT1 and eNOS signaling. In A, sinusoidal endothelial cells were exposed to PP2 (10 μm) for 2 h and then stimulated with insulin (10 nm) for 30 min. Phospho-eNOS (P-eNOS) and phospho-Src (P-Src) were detected by immunoblotting as described under “Experimental Procedures.” Conditioned medium was collected, and nitrite levels were measured and are shown in the bottom panel (n = 4; error bars represent S.E.; *, p < 0.005 versus control; **, p < 0.001 versus insulin stimulation control). In B, sinusoidal endothelial cells were exposed to PP2 (20 nm) for 2 h and then stimulated with ET-1 for 30 min. GIT1 tyrosine phosphorylation was detected as in Fig. 2. In the graphs shown in the bottom panel, bands corresponding to phospho-GIT1 were quantified and normalized to the level of immunoprecipitated (IP) GIT1 (n = 5; error bars represent S.E.; *, p < 0.005 versus ET-1 control). In C, sinusoidal endothelial cells were exposed to ET-1 from 10 to 20 nm for 30 min, and cell lysates were subjected to immunoblotting (IB) to detect phospho-Src or total Src. In the bottom graph, bands corresponding to Src phosphorylation were quantified (n = 3; error bars represent S.E.; *, p < 0.05; **, p < 0.01 versus control). In D, sinusoidal endothelial cells were exposed to PP2 (10 μm) for 2 h and then stimulated with ET-1 (10 nm) for 30 min. Cells were collected, and phospho-Src at Tyr416, phospho-Akt (P-Akt) at Ser473, phospho-eNOS at Ser1177, total Src, Akt, and eNOS were detected by immunoblotting as described under “Experimental Procedures.” In the graphs shown in the bottom panels, bands corresponding to phospho-Src, phospho-Akt, and phospho-eNOS were quantified and normalized to the level of total eNOS, Akt, and Src, respectively (n = 3; error bars represent S.E.; *, p < 0.001; **, p < 0.05 versus ET-1 control). In E, cells were exposed to PP2 (10 μm) for 2 h and then stimulated with ET-1 (10 nm) for 30 min. Conditioned medium was collected, and nitrite levels were measured (n = 4; error bars represent S.E.; *, p < 0.001 versus control; **, p < 0.005 versus ET-1 control).

