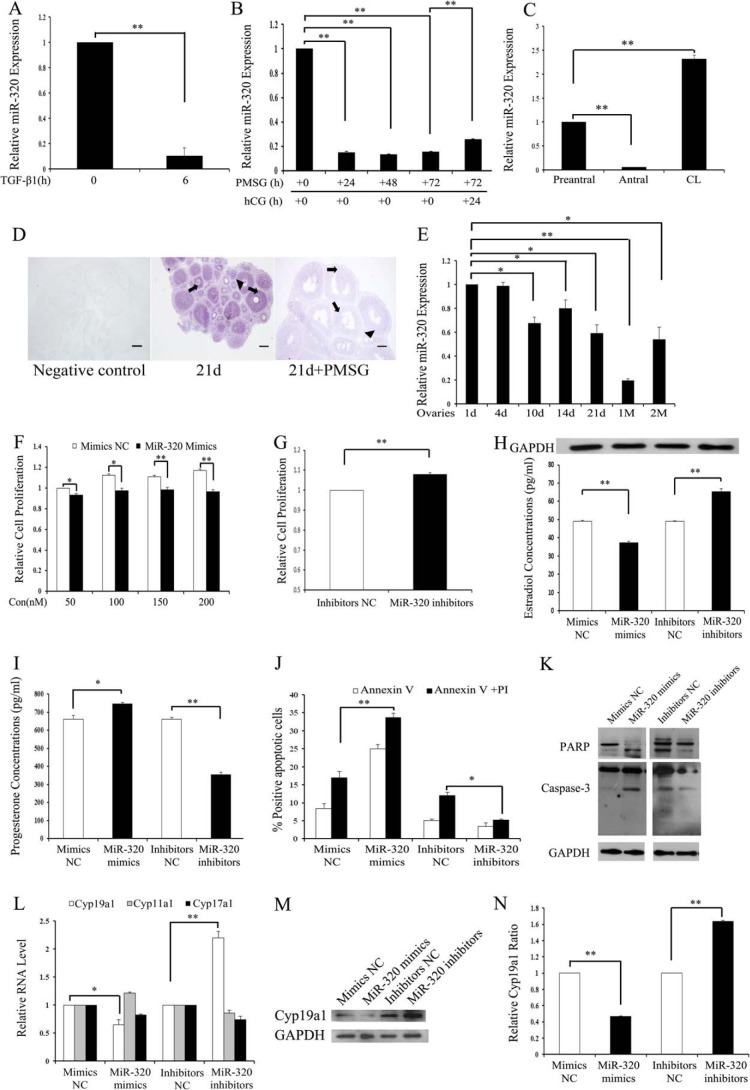
FIGURE 1.
miR-320 regulates cell proliferation and steroidogenesis in mouse ovarian GCs. A, TGF-β1 inhibited miR-320 expression in GCs. mGCs were treated with TGF-β1 (5 ng/ml) for 0 and 6 h and then subjected to real time PCR analysis. B, changes of miR-320 expression in ovaries of PMSG/hCG-treated immature mice. Total RNA was extracted from the ovaries of PMSG (20 IU)-treated mice at 0, 24, 48, or 72 h and PMSG/hCG-treated mice at the indicated post-hCG time points and then subjected to real time PCR analysis. C, miR-320 expression levels in pre-antral, antral, and CL. Total RNA was extracted from pre-antral, antral, and CL and then subjected to real time PCR. The expression of miR-320 in the pre-antral follicles was arbitrarily set at 1.0. D, miR-320 is mainly expressed in GCs (arrow) and oocytes (arrowhead) of ovarian follicles at various developmental stages. The localization of miR-320 was performed on 8-μm frozen ovarian sections of PND 21 and PMSG-treated mice by ISH using LNA-modified DNA probe complementary to miR-320. Purple denotes hybridization signals for miR-320. Scale bar, 100 μm. d, day. E, miR-320 expression in ovaries of PND 1, 4, 10, 14, 21, 1M, and 2M mice. Total RNA was extracted from the ovaries of PND 1, 4, 10, 14, 21, 1M, and 2M mice and then subjected to real time PCR analysis. The expression of miR-320 in the ovary of PND 1 mice was arbitrarily set at 1.0. F and G, overexpression and knockdown of miR-320 significantly inhibited and stimulated GC proliferation, respectively. Cell viability was measured by the CCK-8 assay after transfection with 50, 100, 150, or 200 nm miR-320 mimics and mimics NC or with 150 nm miR-320 inhibitors and inhibitors NC. H and I, miR-320 significantly repressed E2 secretion and promoted progesterone release from GCs. GCs were transfected with 120 nm miR-320 mimics and mimics NC or 150 nm miR-320 inhibitors and inhibitors NC. After 48 h of culture, media were collected for the measurement of E2 and progesterone levels, and cell lysate was used for the detection of GAPDH expression by Western blotting. J, miR-320 increased cell apoptosis. The apoptosis rate was analyzed using flow cytometry with annexin V and propidium iodide staining after transfection either with 100 nm miR-320 mimics/mimics NC or with 150 nm miR-320 inhibitors/inhibitors NC for 48 h. K, miR-320 regulated the expression of caspase-3 and PARP. Cells were transfected with oligonucleotides as described in J. The protein expressions of caspase-3 and PARP were determined by Western blotting. L–N, miR-320 reduces Cyp19a1 mRNA (L) and protein (M and N) expression levels in mGCs. GCs were transfected with oligonucleotides as described in H. The mRNA expression of Cyp19a1, Cyp17a1, and Cyp11a and protein expression of CYP19A1 were determined by real time PCR and Western blotting, respectively. Representative Western blotting for CYP19A1 (upper bands) and GAPDH (lower bands) (M) and the corresponding densitometric analysis (N) are shown. A–C, E–J, L, and N, data represent the mean ± S.E. of three independent experiments performed in triplicate. *, p < 0.05; **, p < 0.01. Con, concentration.

