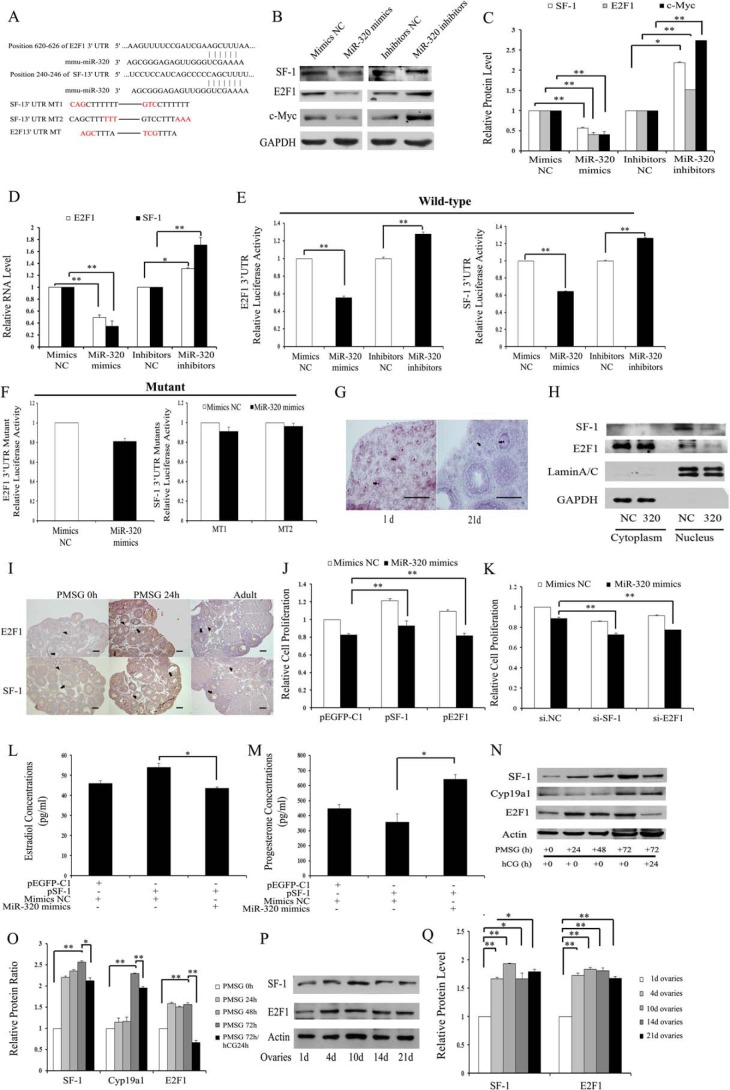
FIGURE 2.
E2f1 and Sf-1 are direct targets of miR-320. A, putative binding sites for mmu-miR-320 are predicted in the 3′UTR of E2f1 and Sf-1 mRNA. The underlined nucleotides indicate the mutated bases of predicted miR-320-binding sites. E2f1 3′UTR MT, E2f1 3′UTR mutation type; Sf-1 3′UTR MT, Sf-1 3′UTR mutation type. B–D, miR-320 reduces E2F1, SF-1, and c-Myc protein (B and C) and mRNA (D) expression levels in mGCs. GCs were transfected with oligonucleotides as described in Fig. 1. The mRNA and protein expression of E2F1, SF-1, and c-Myc were determined by real time PCR and Western blotting, respectively. Representative Western blotting for SF-1 (upper bands), E2F1 (upper middle bands), c-Myc (lower middle bands), and GAPDH (lower bands) (B) and the corresponding densitometric analysis (C) are shown. The ratio of the SF-1/E2F1/c-Myc band intensity over the GAPDH band intensity in controls was arbitrarily set at 1.0. E and F, effect of miR-320 on E2F1 and SF-1 3′UTR luciferase activities. miR-320 mimics inhibit E2F1 and SF-1 (E) 3′UTR luciferase activities. In contrast, knockdown of miR-320 (E) or seed mutant (F) forms of miR-320 could no longer inhibit reporter luciferase activities. Cells were co-transfected with wild type (WT) E2F1 and SF-1 (E) 3′UTR or mutant E2F1 and SF-1 (F) 3′UTR reporter constructs and miR-320 mimics/mimics NC, or miR-320 inhibitors/inhibitors NC. After 30 h of transfection, Firefly luciferase activity and Renilla luciferase activity were measured. The value from cells co-transfected with mimics NC and plasmid expressing WT E2F1/SF-1 3′UTR was arbitrarily set at 1. G, miR-320 expression in the nucleus (arrowhead) of GCs and oocytes. The localization of miR-320 was performed as described in Fig. 1D. Purple denotes hybridization signals for miR-320. Scale bar, 100 μm. H, Western blotting analysis of SF-1 and E2F1 expression in the nucleus and cytoplasm. Lysates from mouse GCs transfected with miR-320 mimics/mimics NC were separated into cytosolic and nuclear fractions and then immunoblotted with antibodies against SF-1, E2F1, lamin A/C, and GAPDH. Lamin A/C and GAPDH were used as markers for nuclear and cytoplasmic fractions, respectively. I, immunohistochemical staining for E2F1 and SF-1 in the ovaries from immature mice that were either untreated (PMSG 0 h) or treated with PMSG for 24 h (PMSG 24 h), and from adult mice. E2F1 and SF-1 proteins (stained brown) are mainly located in GCs (arrowhead) and oocytes (arrow) at different stages of follicular development. Scale bar, 50 μm. J, overexpression of E2F-1 or SF-1 partially rescued miR-320-induced proliferation suppression. Cell viability was analyzed after co-transfection with miR-320 mimics/mimics NC and pEGFP-E2F1/pEGFP-SF-1/control vector into GCs. K, silencing of E2F-1 or SF-1 enhanced miR-320-induced proliferation suppression. Cell viability was analyzed after co-transfection with miR-320 mimics/control and 50 nm si-E2F1/si-SF-1/si.NC into GCs. L and M, miR-320 significantly attenuated SF-1-induced E2 synthesis and rescued SF-1-mediated progesterone suppression in GCs. GCs were co-transfected with miR-320 mimics/mimics NC and pEGFP-SF-1/control vector. After 48 h of culture, media were collected for the measurement of E2 (L) and progesterone (M) levels. N and O, changes in E2F1, SF-1, and CYP19A1 expression in ovaries of PMSG/hCG-treated immature mice. Total protein was extracted from ovaries of PMSG (20 IU)-treated mice at 0, 24, 48, or 72 h and PMSG/hCG-treated mice at indicated post-hCG time points and then subjected to Western blotting analysis (N). Representative Western blotting for SF-1 (upper bands), CYP19A1 (upper middle bands), E2F1 (lower middle bands), and actin (lower bands) (N) and the corresponding densitometric analysis (O) are shown. The ratio of the SF-1/CYP19A1/E2F1 band intensity over the actin band intensity in PMSG-untreated ovaries was arbitrarily set at 1.0. P and Q, E2F1 and SF-1 expression in ovaries of PND 1, 4, 10, 14, and 21 mice. Total protein was extracted from ovaries of PND 1, 4, 10, 14, and 21 mice and then subjected to Western blotting analysis (P). Representative Western blotting for SF-1 (upper bands), E2F1 (middle bands), and actin (lower bands) (P) and the corresponding densitometric analysis (Q) are shown. The ratio of the SF-1/E2F1 band intensity over the actin band intensity in PND 1 ovaries was arbitrarily set at 1.0. In C–F, J–M, O and Q, data represented the mean ± S.E. of three independent experiments performed in triplicate. *, p < 0.05; **, p < 0.01. +, present; −, absent.

