FIGURE 3.
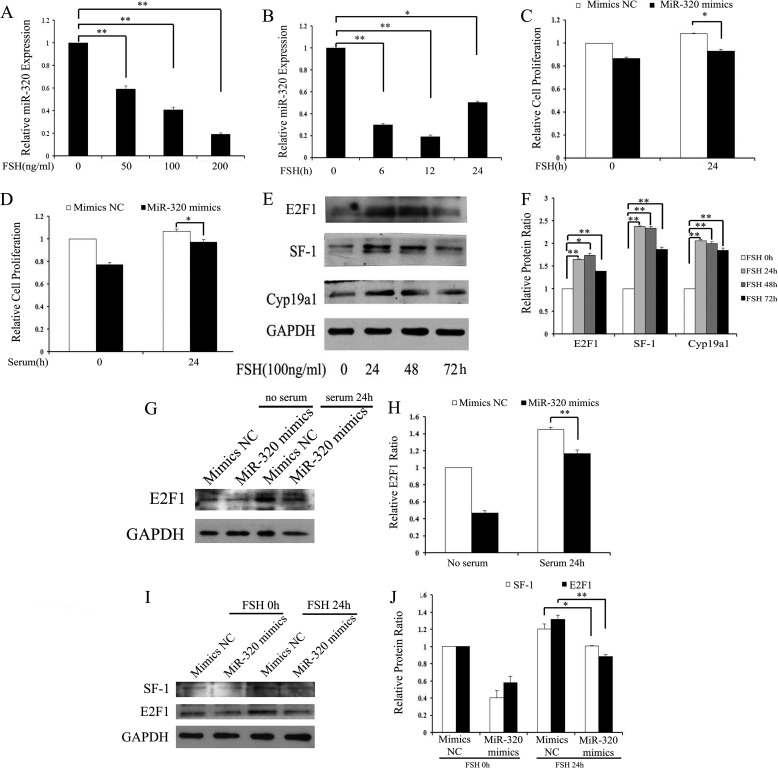
FSH suppresses the expression of miR-320. A and B, FSH repressed miR-320 expression. GCs were treated with FSH for the indicated time periods (A) and doses (B), and the expression levels of miR-320 were then examined by real time PCR analysis. C and D, miR-320 decreased GC proliferation induced by FSH (C) or serum (D). Cell viability was analyzed after transfection with miR-320 mimics/mimics NC and FSH/serum treatment/no treatment in GCs. E and F, FSH up-regulated E2F1 and SF-1 protein expression in mGCs. Cells were treated with 100 ng/ml FSH for the indicated time periods, and the expression levels of E2F1, SF-1, and CYP19A1 were then examined by Western blotting analysis (E). Representative Western blotting for E2F1 (upper bands), SF-1 (upper middle bands), CYP19A1 (lower middle bands), and GAPDH (lower bands) (E) and the corresponding densitometric analysis (F) are shown. The ratio of the SF-1/CYP19A1/E2F1 band intensity over the GAPDH band intensity in FSH untreatment was arbitrarily set at 1.0. G and H, overexpression of miR-320 inhibited serum-inducible E2F1 protein expression. Cells were transfected with the indicated oligonucleotides after serum starvation for 12 h. For Western blot analysis, cells were harvested 24 h after serum stimulation (G). Representative Western blotting for E2F1 (upper bands), and GAPDH (lower bands) (G) and the corresponding densitometric analysis (H) are shown. The ratio of the E2F1 band intensity over the GAPDH band intensity in Mimics NC/no serum treatment was arbitrarily set at 1.0. I and J, overexpression of miR-320 inhibited FSH-inducible E2F1 and SF-1 protein expression. Cells were transfected with the indicated oligonucleotides after serum starvation for 12 h. For Western blot analysis, cells were harvested 24 h after FSH treatment. Representative Western blotting for SF-1(upper bands), E2F1 (middle bands), and GAPDH (lower bands) (I) and the corresponding densitometric analysis (J) are shown. The ratio of the E2F1 band intensity over the GAPDH band intensity in Mimics NC/no serum treatment was arbitrarily set at 1.0. In A–D, F, H, and J, data represented the mean ± S.E. of three independent experiments performed in triplicate. *, p < 0.05; **, p < 0.01.

