
Fig. 3.
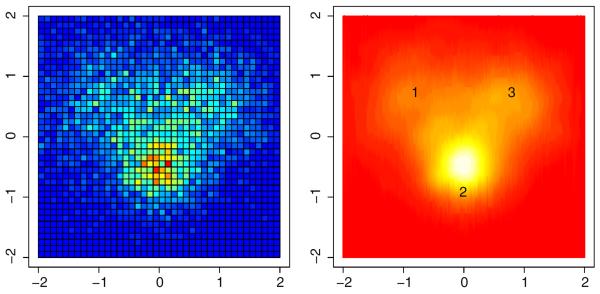
An example of how the neural model explains the raw data (left panel) through a finite mixture of normal distributions (right panel). Voxels that have larger degrees of activity are translated to regions of larger activation in the corresponding source of the normal mixture model.