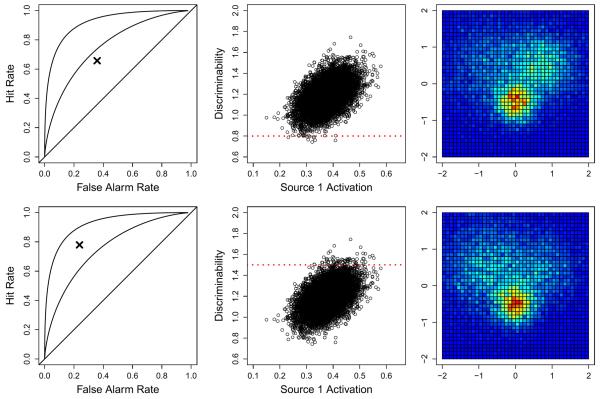
Fig. 5.
Two examples of predictions made from the joint model given only behavioral data. The rows correspond to the two different subjects — the first row represents a subject with low discriminability and the bottom row represents a subject with high discriminability. The left panels show two simulated subjects having only behavioral data (i.e., no neural data) in the form of a hit (y-axis) and false alarm (x-axis) rate, shown as the “x” symbol. Reference lines of d={0,1,2} are shown in the left panels. The middle panels show the joint distribution of the activation of Source 1 against discriminability, a relationship that was inferred from the full set of data. The red horizontal dashed lines represent the estimated discriminability (i.e., the parameter d) from the data in the corresponding row (see the left panels). The right panels show the predicted distribution of neural data at the voxel level.

