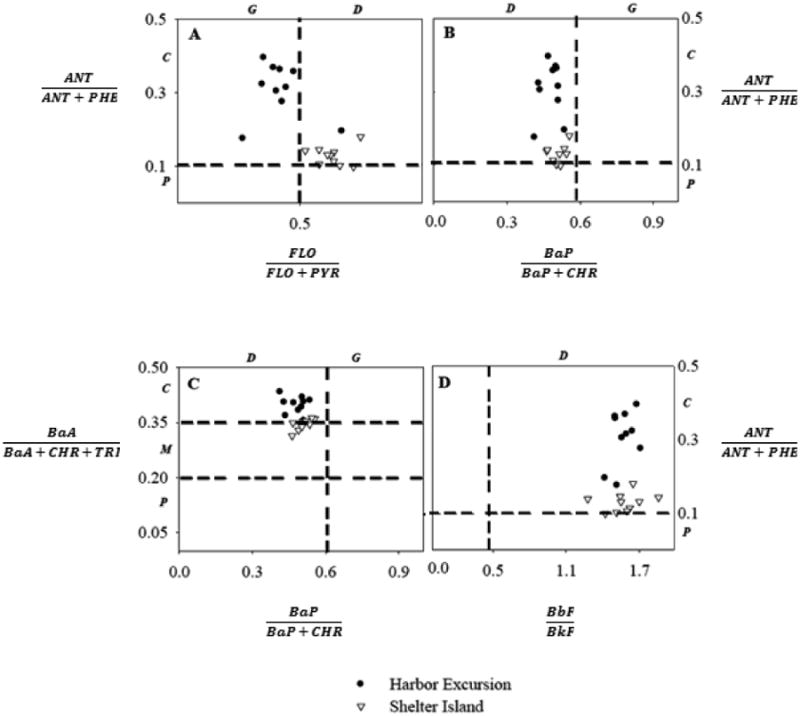
Figure 5.

Bi-variate plots of PAH diagnostic ratios for PS pellets deployed in both sampling sites. (A) FLO/(FLO+PYR) vs. ANT/ (ANT+PHE), (B) BaP/(BaP+CHR) vs. ANT/(ANT+PHE), (C) BaP/ (BaP+CHR) vs. BaA/(BaA+CHR+TRI), (D) BbF/BkF vs. ANT/ (ANT+PHE). Dashed lines represent threshold values and letters in italics represent possible sources: G = gasoline, D = diesel, C = combustion of petroleum derivatives, P = PAHs from petroleum, M = mix sources.
