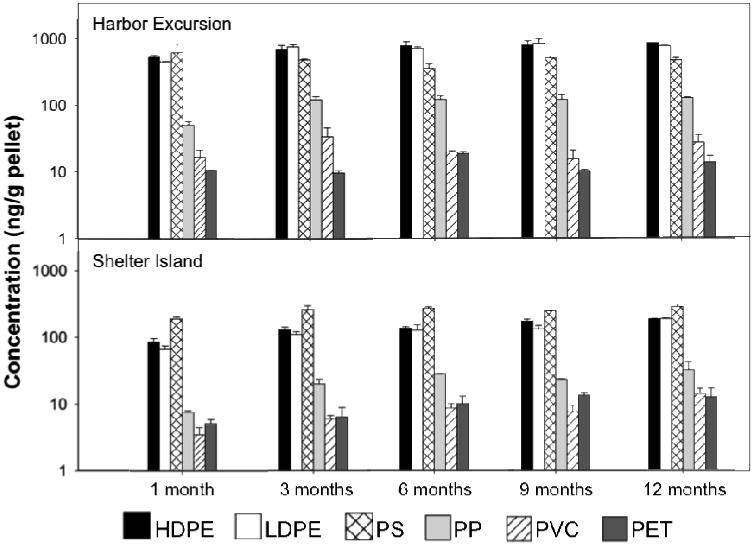
Figure 6.

Mean concentrations (+/- S.E.) of ΣPPAHs (ng/g) sorbed to each plastic type at each location during each sampling period (1, 3, 6, 9 and 12 months; n=2). Harbor Excursion (HE-site) is shown on the top and Shelther Island (SI-site) on the bottom. At each sampling period, 2-factor ANOVA showed significant differences among plastic types (p<0.001) and locations (p<0.001), and post-hoc Tukey comparisons consistently distinguished HDPE, LDPE and PS as a group of plastics with the largest PPAH concentrations and PET and PVC with the smallest PPAH concentrations.
