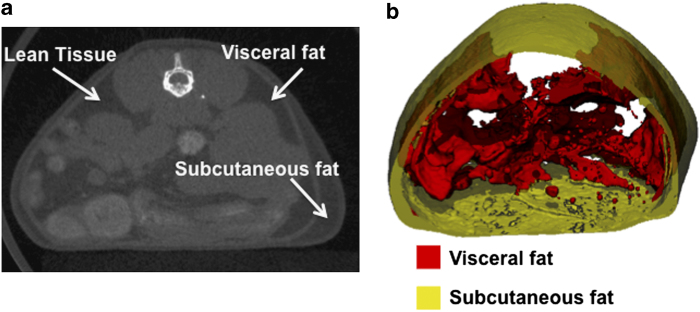
Figure 12.
Segmentation of visceral and subcutaneous adipose tissue in a mouse. Regions of lean, visceral fat and subcutaneous fat tissue are shown in a tomographic slice (a), and the corresponding visualisation of the segmentation is shown (b) with the inner visceral fat depicted in red and the outer subcutaneous fat depicted in semitransparent yellow.

