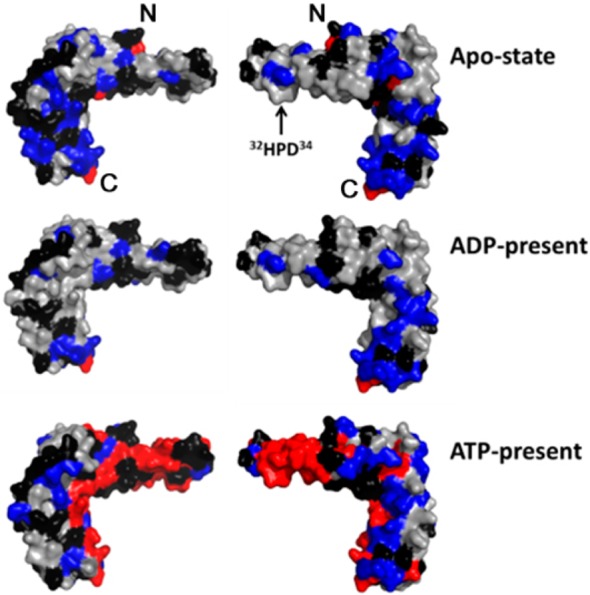
Figure 2.

Results from the NMR signal perturbation profiles (panels C, F, and I of Figure 1) of [U-15N]-HscB with HscA(T212V) mapped onto the structure of HscB (PDB 1FPO).30 Color code: black, residues with no signal (Pro), unassigned residues, or residues whose signals could not be followed upon addition of HscA(T212V); gray, residues whose signals were minimally affected (ΔδNH ≤ 0.01 ppm) by addition of HscA(T212V); blue, residues with ΔδNH > 0.01 ppm; and red, residues whose signals broadened beyond detection. Only the surface of the structure is shown to better represent the putative HscA binding interface. The N- and C-terminals of HscB are denoted by “N” and “C”, respectively.
