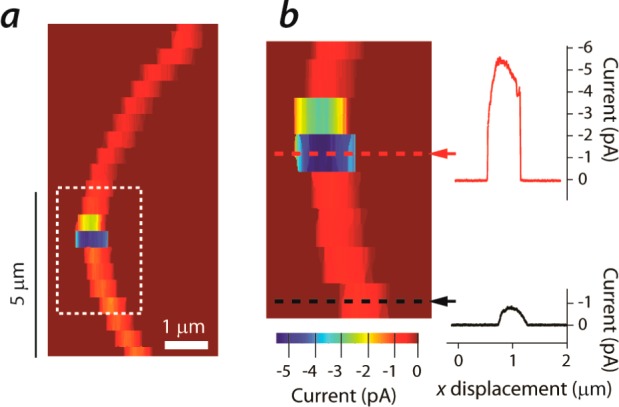
Figure 2.

(a) Electrochemical map of a pristine SWNT that contained a kinked region. (b) Separate zoom-in electrochemical map of (a). Line scans of kinked region (red dashed line in (b)) and pristine site (black dashed line in (b)) highlighted in map (b). Maps obtained at −1.0 V vs Ag/AgCl QRCE.
