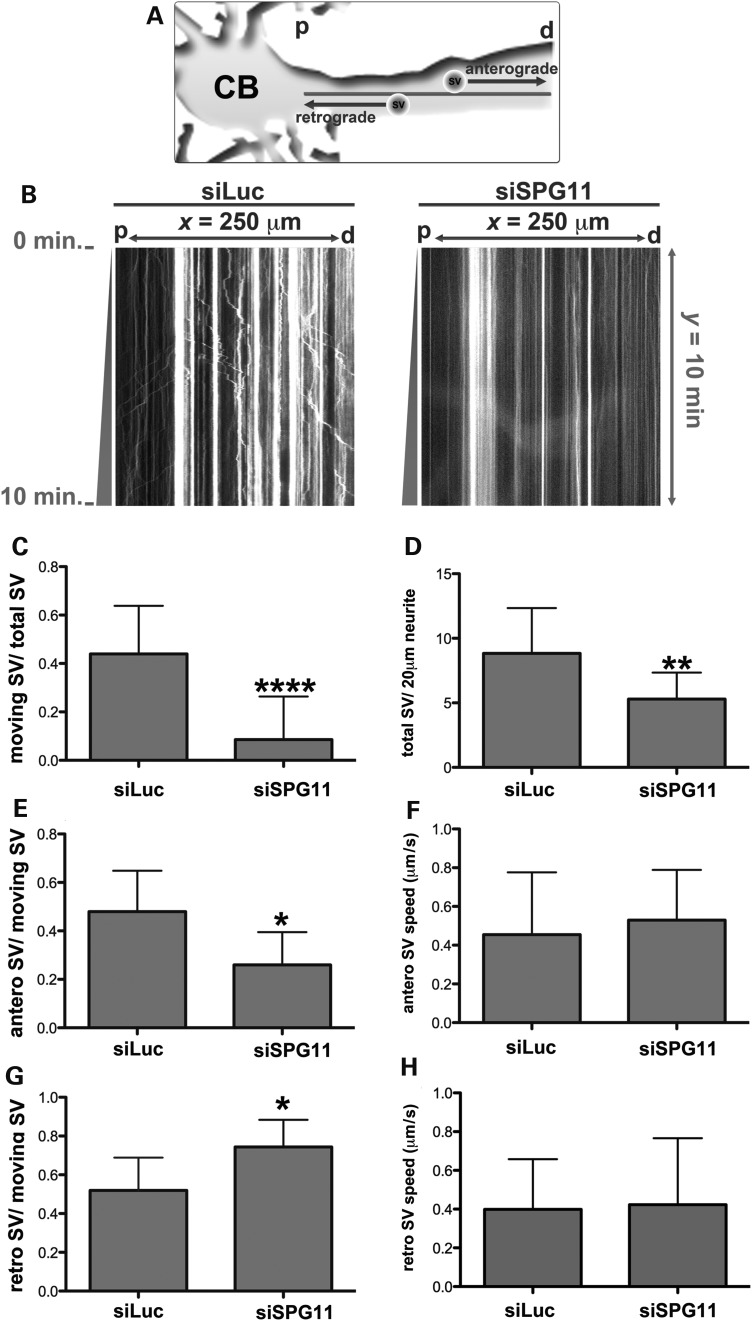
Figure 7.
Knockdown of spatacsin disrupts SV transport. (A) Illustration of time-lapse monitoring of SV transport. SVs were visualized in neurons by expressing synaptophysin-mCherry. The neuronal cell body (CB) was used as a reference to regionalize proximal (p) and distal (d) neurite regions, and thereby distinguish the directions of anterograde and retrograde transports. (B) Kymographs representing SV transport in neurites transfected with synaptophysin-mCherry together with siLuc or siSPG11. The x-axis represents the neurite length (x = 250 µm) from proximal (p) to distal (d) areas. The y-axis indicates time-lapse duration in min (y = 10 min). Vertical lines exemplified stationary SVs (x < 5 µm), trajectories with × ≥ 5 µm considered moving SVs. Movements toward ‘p’ or ‘d’ revealed retrograde or anterograde transport, respectively. (C–H) Graphs indicate a significant decrease in the number of moving SVs and the average SV speed. All data were represented as mean ± SD; n ≥ 20 axons per experimental condition. (C) The ratio of total moving SVs in relation to the total number of SVs (****P < 0.0001). (D) The ratio of total SVs (total SV) per each 20 µm of neurite (**P ≤ 0.005). (E) The ratio between SVs moving anterogradely (antero SV) in relation to the total number of moving SVs (*P < 0.05). (F) The average speed of SVs moving anterogradely (antero SV speed in µm/s) (P > 0.05). (G) The ratio between SVs moving retrogradely (retro SV) in relation to the total number of moving SVs (*P < 0.05). (H) The average speed of SVs moving retrogradely (retro SV speed in µm/s; P > 0.05).

