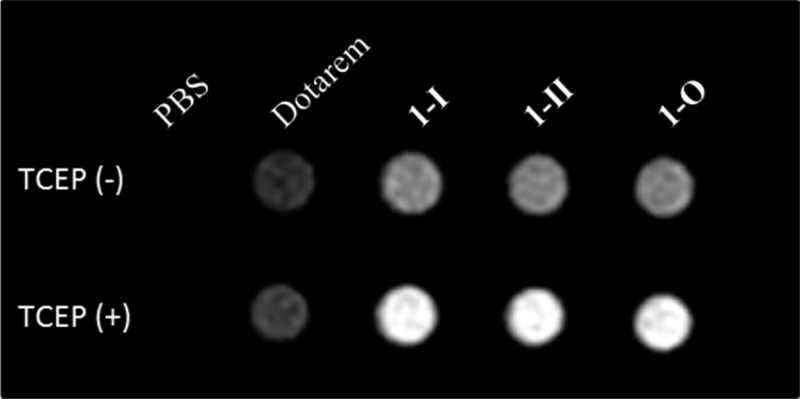
Figure 5.
T1-weighted MR images of Dotarem, 1-I, 1-II, and 1-O at the same Gd3+ concentration (800 μM) in PBS buffer (10×, pH 7.4) before and after incubation with TCEP (2 mM) at r.t. overnight. The images were acquired at a 0.5 T MR scanner (Signa HDx, GE Healthcare, Waukesha, Wisconsin) at 37 °C, using a fast spin–echo pulse sequence (TE/TR = 19/117 ms).

