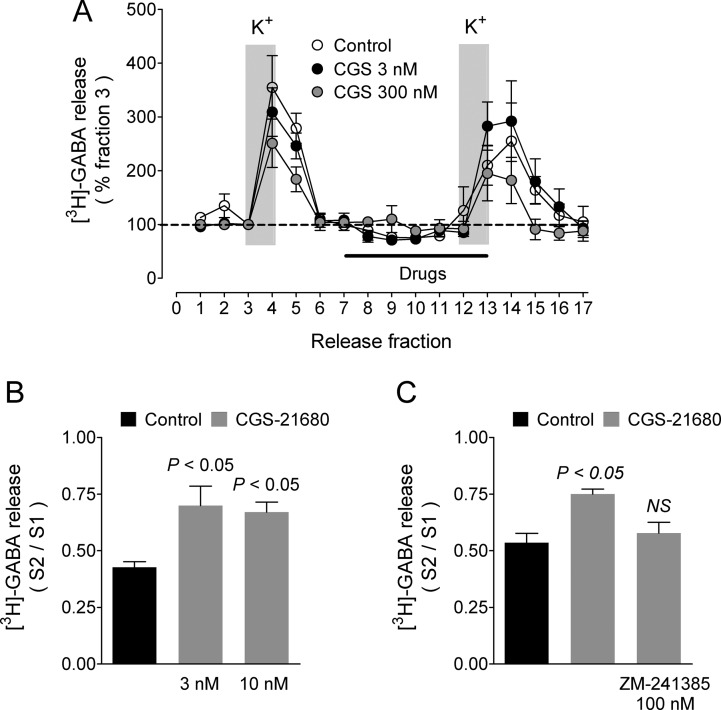
Figure 4.
Effect of the adenosine A2A receptor agonist CGS-21680 on depolarization-evoked [3H]-GABA release from rat globus pallidus synaptosomes. (A) Representative experiments for 3 and 300 nM. Labeled synaptosomes were perfused with KRH solution (4 mM K+), and neurotransmitter release was evoked by raising the K+ concentration in the perfusion medium to 20 mM for the periods indicated by the vertical gray bars. Where required, drugs under test were present for the period indicated by the black bar. Values are expressed as a percentage of [3H]-GABA in fraction 3 and represent the means ± SEM of 4–6 replicates. (B) Statistical analysis for 3 and 10 nM CGS-21680. Values are means ± SEM from three experiments. P values are for the comparison with control release (no drugs added). For panels (B) and (C), the statistical analysis was performed with ANOVA and Dunnett’s post hoc test. (C) Blockade by the A2A receptor antagonist ZM-241385 of the effect of 3 nM CGS-21680. Values are means ± SEM from three experiments. NS, not different from control release.

