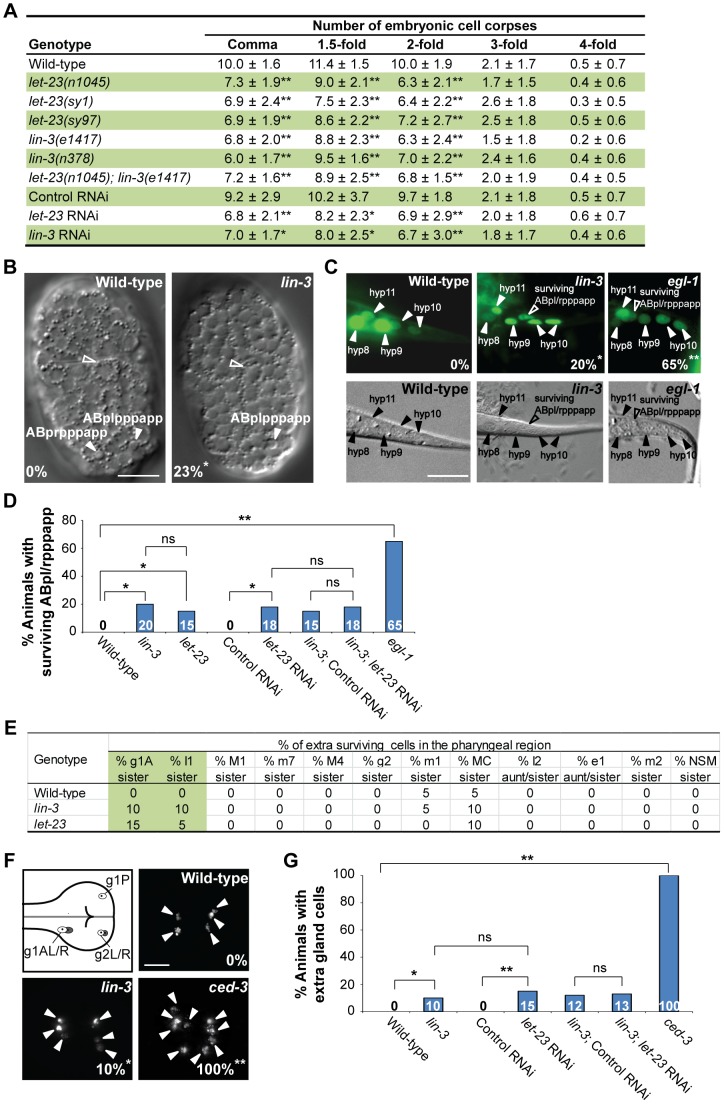
Figure 1. lin-3 and let-23 promote specific PCDs in C. elegans.
(A) The number of cell corpses was scored at indicated developmental stages and presented as the mean ± SD (n≥30). The rrf-3(pk1426) mutant was used to enhance the RNAi effect in RNAi experiments. Mutants were compared to wild-type, and RNAi treatment of individual genes was compared to control RNAi (*P<0.05 and **P<0.001, two-tailed t test). (B) The DIC images of the wild-type and lin-3(e1417) mutant embryos at approximately 270 min after fertilization. The white arrowheads indicate ABpl/rpppapp cell corpses and the hollow arrowheads indicate excretory cells. The percentage of embryos that did not have ABpl/rpppappcell corpse is shown in the bottom left corner. *P = 0.048 when compared to wild-type (Fisher's exact test). Twenty one and thirteen embryos were scored for wild-type and lin-3 mutants, respectively. Scale bar: 10 µm. (C) The GFP and DIC images of the wild-type, lin-3(e1417), and egl-1(n1084n3082) worms expressing sur-5::gfp at the L1 stage. The arrowheads indicate the nuclei of hyp8, hyp9, hyp10, and hyp11. The hyp10 cell is binuclear. The hollow arrowheads indicate a surviving ABpl/rpppapp. The percentage of worms with surviving ABpl/rpppapp is shown in the bottom right corner. *indicates P<0.05 and **P<0.001 when compared to wild-type (Fisher's exact test). More than thirty worms were scored for each genotype. Scale bar: 10 µm. The GFP protein expressed from the sur-5::gfp transgene is localized to almost all somatic nuclei [86]. (D) The percentage of worms with surviving ABpl/rpppapp of the indicated genotypes was shown. *indicates P<0.05 and **P<0.001 (Fisher's exact test). ns indicates no statistical difference (p>0.05). Alleles used here are lin-3(e1417), let-23(sy1), and egl-1(n1084n3082). More than thirty worms were scored for each genotype. (E) Analysis of surviving cells in the pharyngeal region (n = 20). Alleles used here are lin-3(e1417) and let-23(n1045). (F) The g1 and g2 gland cells in the pharynx are shown in the illustration. The white circles indicate the five gland cells (g1P, g1AL, g1AR, g2L, and g2R) that normally survive and the gray circles the sister cells of g1AL, g1AR, g2L, and g2R that are destined to die. Monomeric red fluorescent protein (mRFP) images of the wild-type, lin-3(e1417), and ced-3(n717) worms expressing PB0280.7::4Xnls::mrfp are shown. The arrowheads indicate cells expressing mRFP. The percentage of animals that have extra gland cell(s) is shown in the bottom right corner. *indicates P<0.05 and **P<0.001 when compared to wild-type (Fisher's exact test). One hundred L4 animals were scored for each genotype. The image stacks were merged by maximum intensity projection using Image J. Scale bar: 10 µm. (G) The percentage of worms with extra gland cells of the indicated genotypes was shown. *indicates P<0.05 and **P<0.001 (Fisher's exact test). ns indicates no statistical difference (p>0.05). Alleles used here are lin-3(e1417) and ced-3(n717). More than forty worms were scored for each genotype.

