
Figure 4. lin-3 promotes egl-1 transcription.
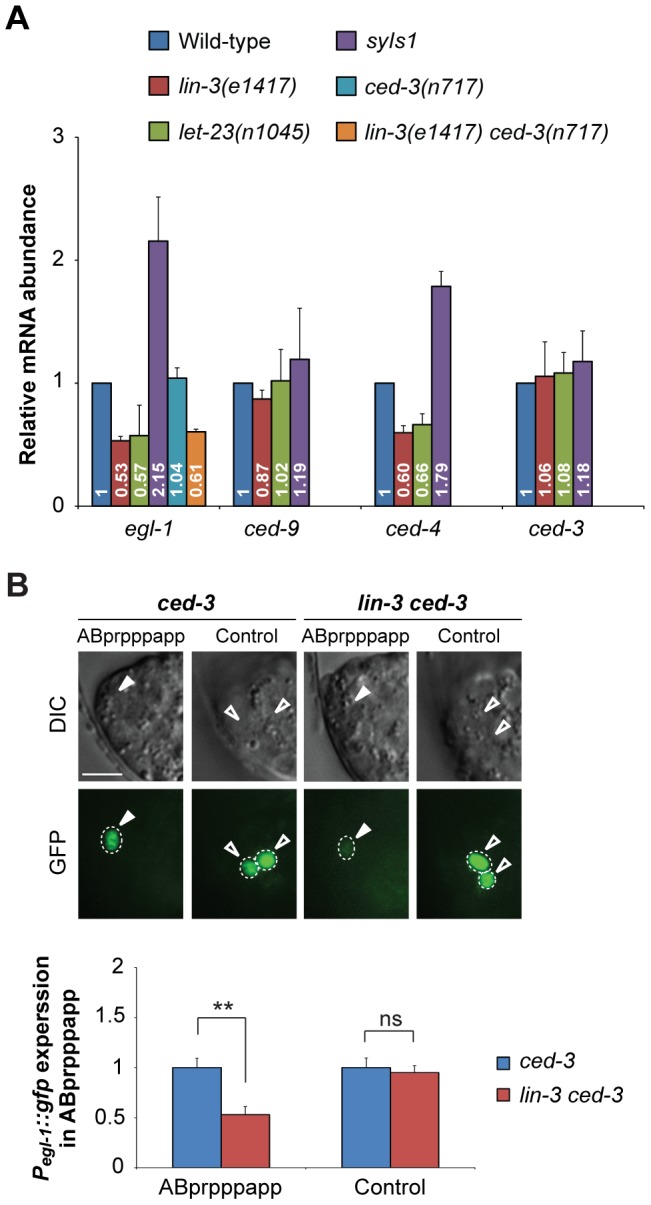
(A) egl-1, ced-9, ced-4, and ced-3 transcripts in embryos of indicated genotypes were measured by quantitative RT-PCR. The relative mRNA abundance is shown as the mean and SD of the results from at least two independent experiments, each performed in triplicates. (B) The DIC and GFP images of ced-3 (left) and lin-3 ced-3 (right) embryos expressing the Pegl-1::gfp transgene. Arrowheads indicate ABprpppapp, and hollow arrowheads indicate two cells that also express egl-1 near ABprpppapp (Control experiment). The bottom figures show the Pegl-1::gfp expression level of the indicated cells in the ced-3 single mutant (blue) and the lin-3 ced-3 double mutant (red). The expression level of Pegl-1::gfp in ABprpppapp of ced-3(n717) (n = 44) and lin-3(e1417) ced-3(n717) (n = 40) mutants was analyzed as described in Materials and Methods. Error bars represent the SEM. **indicates P<0.001 (two-tailed t test). Scale bar: 5 µm.