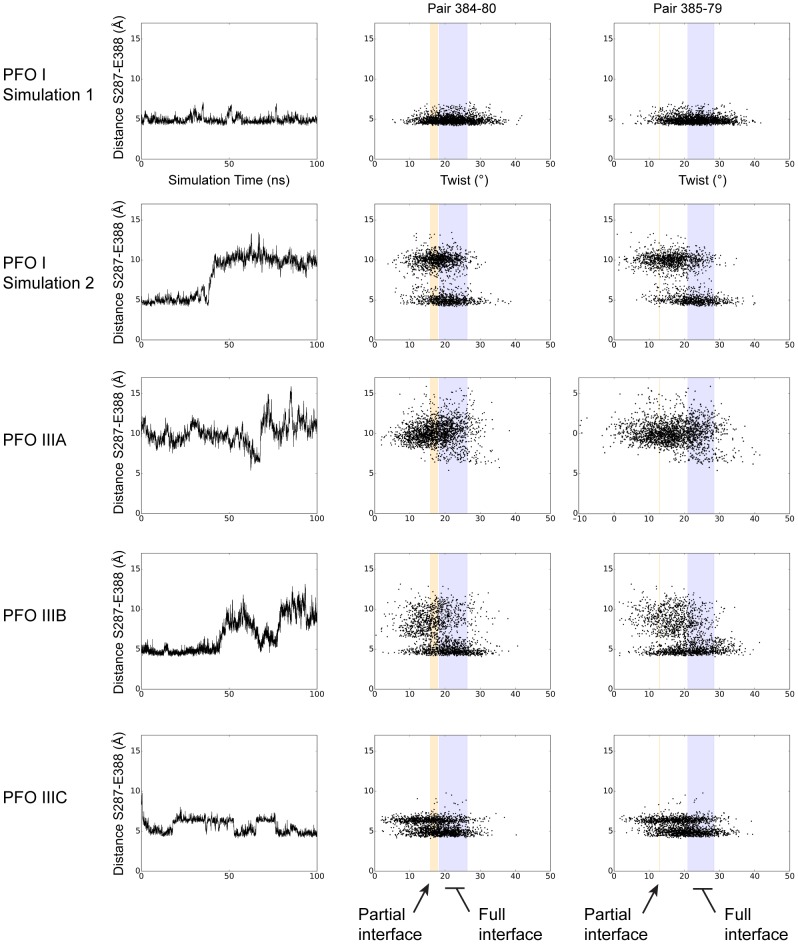
Figure 5. Plasticity and deformation of Domain 2 from PFO MD simulations.
Analysis of the different MD simulations for PFO I, PFO IIIA, PFO IIIB, PFO IIIC (indicated at the left of each panel). Left panel: distance representative of the Domain 2/TMH2 interface between residues 287 and 388 (see also Table 2). Centre and right panels: values of twist at positions discussed in the text and illustrated in Figure 4C plotted versus the distance between residues in left panel. The coloured vertical bars correspond to the range of twist values derived from the analysis of the PFO crystal structures (Figure 4B). The pairs of residues considered are indicated at the top of the figure.

