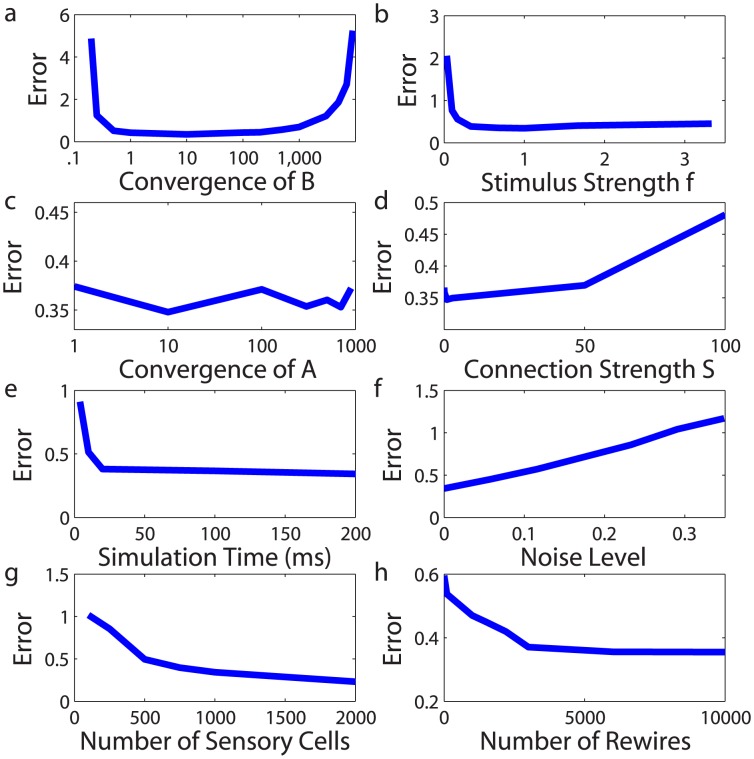
Figure 4. Optimal CS network characteristics.
Characteristics of optimal CS networks examined using the dependence of relative reconstruction error on network features: a convergence of the sensory-cell (sensory-neuron) to receptor connection matrix  , b stimulus strength
  , c convergence of the sensory-cell connection matrix
  , d connection strength
  , e simulation time over which spikes are recorded, f variance of Gaussian noise added to stimulus components, g number of sensory-cells, and h level of randomness in the sensory-cell to receptor connection matrix
  . In panel a, we normalize the stimulus strength
  by
by  , the number of nonzero entries in the receptor-to-sensory-neuron connectivity matrix
  , to keep the amount of drive to a sensory neuron approximately constant when changing convergence. The minimal relative error at the optimal convergence in panel a is approximately equal to 0.35.

