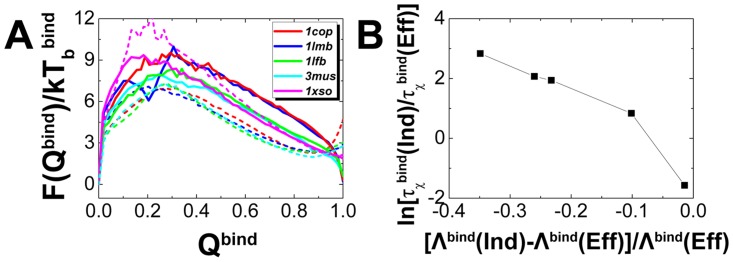
Figure 4. The differences of thermodynamics and kinetics between rigid and flexible binding.
(A) The free energy landscapes of rigid and flexible binding are plotted at the corresponding binding temperature  . (B) The differences of kinetics, represented by the ratio of binding time between rigid and flexible binding, are plotted along the differences of intrinsic specificity between rigid and flexible binding.

