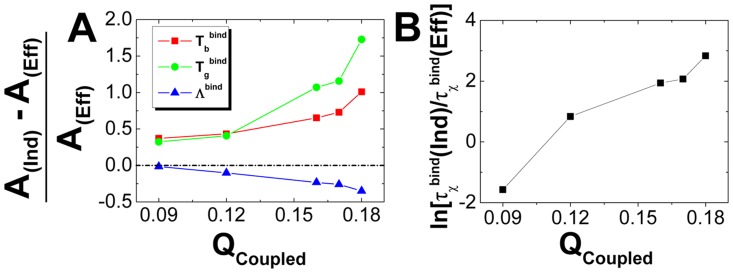
Figure 5. The differences between rigid and flexible binding energy landscapes changes with interfacial flexibility.
(A) The differences between rigid and flexible binding energy landscapes are described by the  , where
  and
and  are the quantities of the rigid and flexible binding. The quantities
  are
are  ,
,  and
and  , corresponding to the binding transition temperature, glassy trapping temperature and binding energy landscape topography measure, respectively. (B) The differences of kinetics, represented by the ratio of association time between rigid and flexible binding, are plotted as a function of
  .
.  describes the degree of interfacial flexibility.

