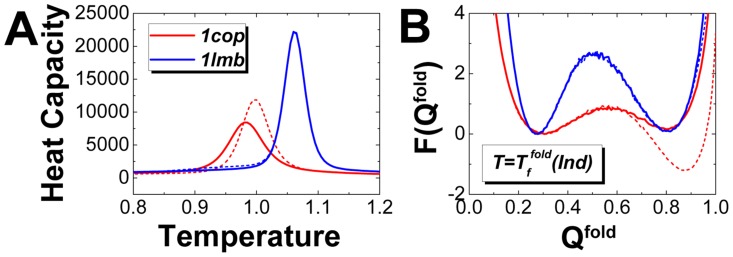
Figure 6. The folding stability for folding with and without interfacial binding shown in (A) heat capacity curves and (B) free energy landscapes for Lambda Cro repressor (red) and Lambda repressor (blue).
The solid and corresponding dotted lines represent isolated (independent) and dimeric (effective) folding respectively. Free energy landscapes are plotted at the isolated folding transition temperatures, which are calculated from the peaks of heat capacity curves for folding, respectively. Free energy is in reduced unit.

