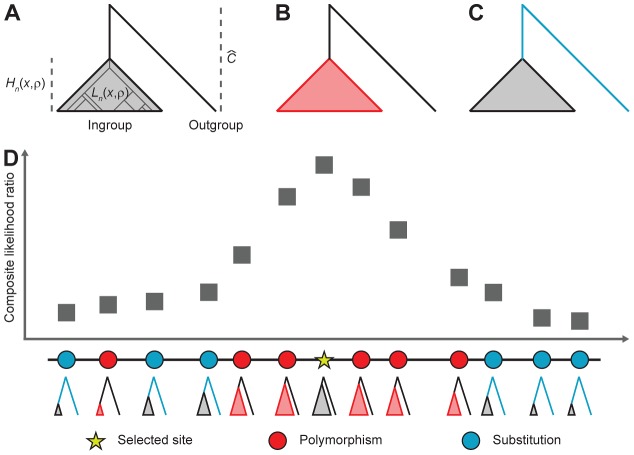
Figure 1. Calculation of probabilities of polymorphism and substitution under a model of balancing selection and the incorporation of these probabilities into a genome scan.
(A) Relationship among tree length  , tree height
  and inter-specific coalescence time
  . (B) A site is polymorphic if a mutation occurred on the
  length of branches until the most recent common ancestor of the ingroup sample (red region). (C) A site is a substitution if a mutation occurred on the
  length of branches that represent the divergence between the outgroup species and the most recent common ancestor of the ingroup species (blue region). (D) Height and length of genealogies in relationship to their spatial proximity to a selected site and how the shapes of these genealogies affect the pattern of polymorphism around the site. The composite likelihood ratio is high near a selected site as there is an excess of polymorphisms close to the site and a deficit far from the site.

