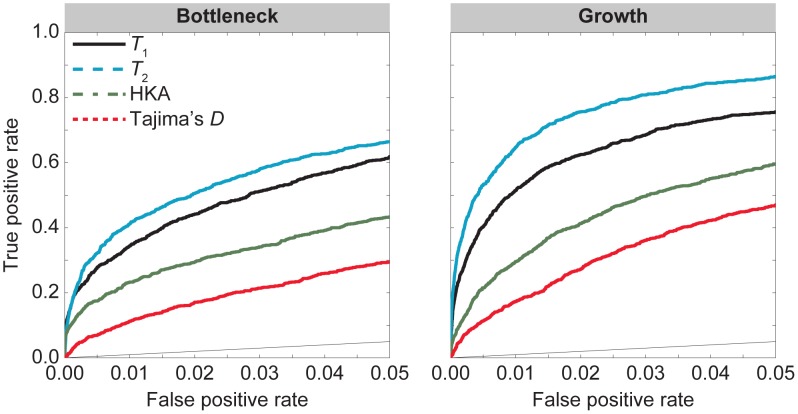
Figure 6. Performance of  ,
,  , HKA, and Tajima's
  under the bottleneck and growth demographic models in Figure 2 with selection parameter
  and dominance parameter
  .
.
The left panel is the divergence model in Figure 2B
with a recent bottleneck within the ingroup species. The right panel is the divergence model in Figure 2C
with recent population growth within the ingroup species. The population sizes for the bottleneck and growth demographic histories have been scaled so that they produce the same number of segregating sites as a constant size population with diploid effective size  individuals.

