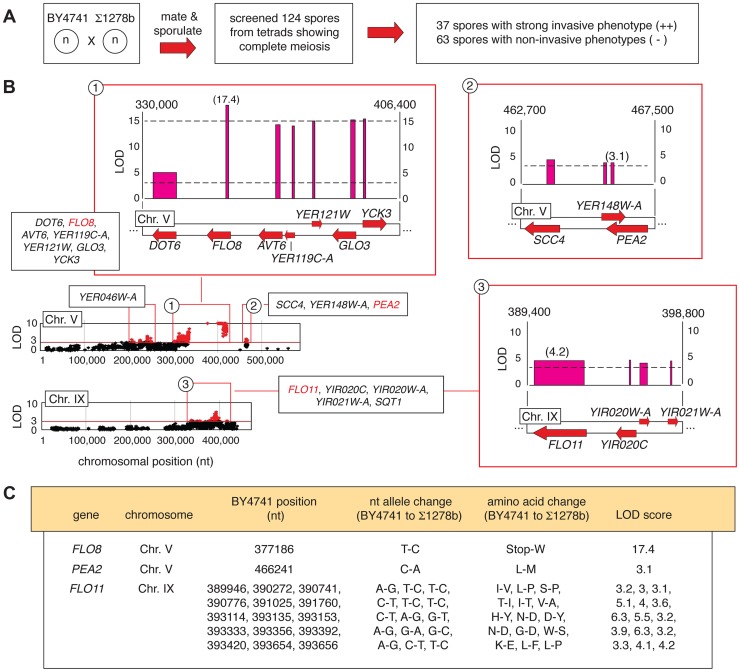
Figure 2. Identification of alleles linked with invasive growth in meiotic progeny from the BY4741-by-Σ1278b cross.
A) Summary of phenotypic screening for invasive growth in haploid spores. B) Plots of non-synonymous allelic changes graphed by chromosomal location are presented, with allelic variation exhibiting a LOD score of greater than 3 highlighted in red. Clusters of alleles with LOD scores greater than 3 are boxed, and expanded blow-ups of loci on Chromosome V and IX housing the invasive growth determinants FLO8, PEA2, and FLO11 are shown. Red arrows represent genes, with forward directionality indicating the Watson strand of the respective chromosome. LOD scores are plotted above each gene. The width of the LOD score bar for each gene corresponds to the chromosomal boundaries of the allelic changes observed in the respective gene coding sequence; a single nucleotide change between the sequences is indicated by a thin line. Chromosomal nucleotides delineating the boundaries of the highlighted region are shown at the upper right and left of each expanded plot. C) Specific nucleotide and amino acid changes between alleles of the FLO8, PEA2, and FLO11 genes are indicated, along with the respective LOD score for each gene.

